. 2024 Apr 12;52(6):2865-2885.
doi: 10.1093/nar/gkae172.

Comprehensive transcriptome analysis reveals altered mRNA splicing and post-transcriptional changes in the aged mouse brain

Affiliations

Comprehensive transcriptome analysis reveals altered mRNA splicing and post-transcriptional changes in the aged mouse brain

Nisha Hemandhar Kumar et al. Nucleic Acids Res. .

Abstract

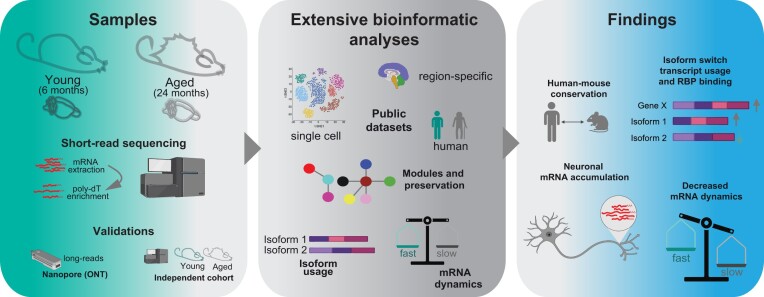
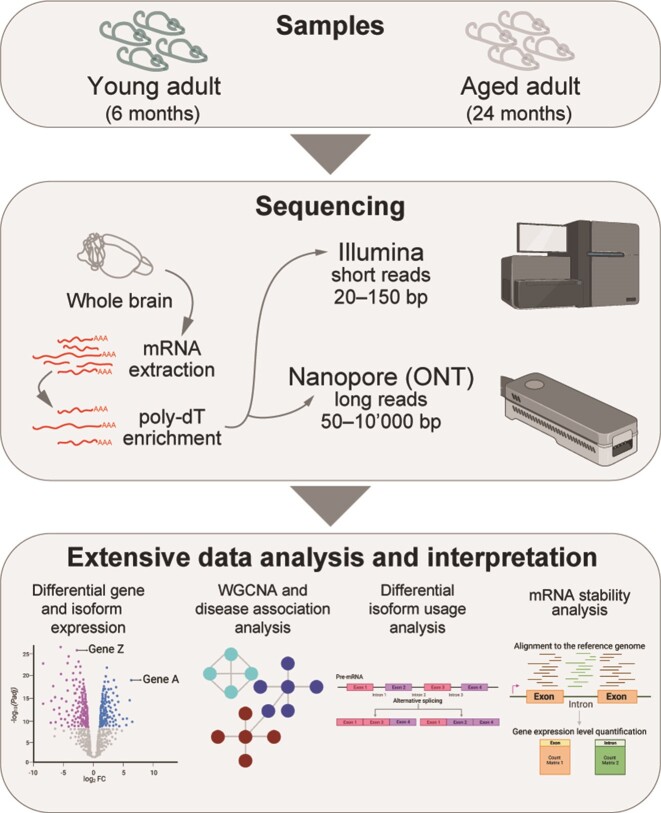
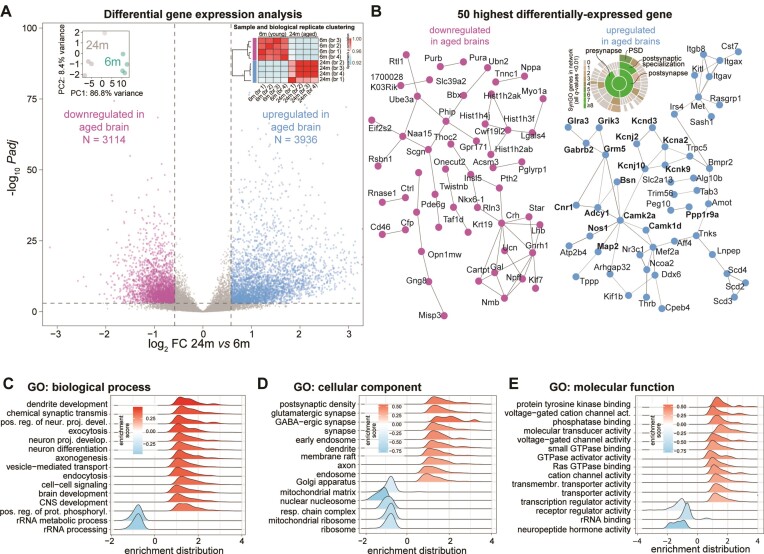
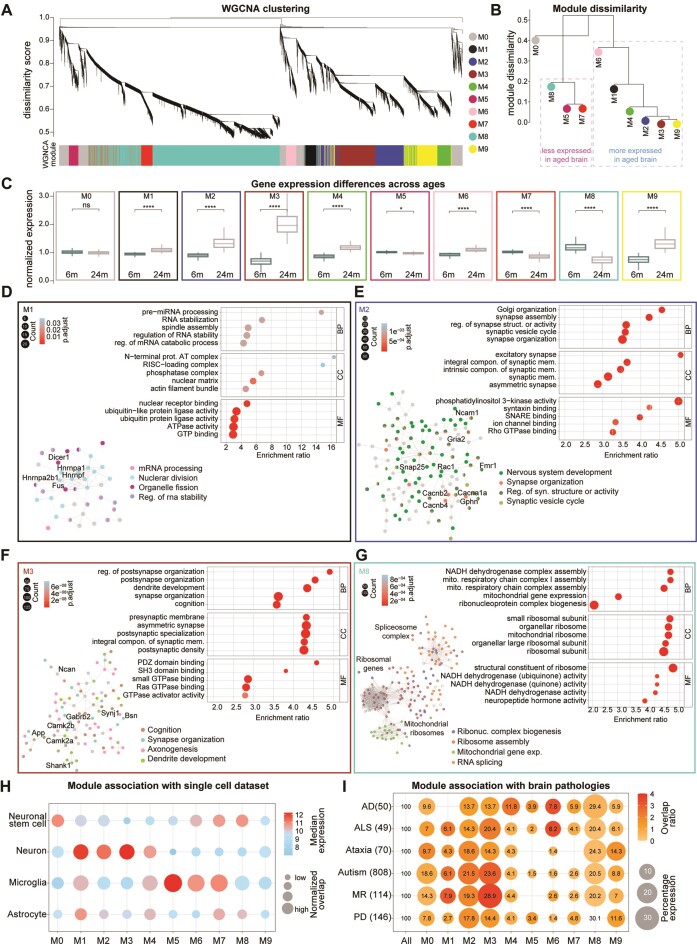
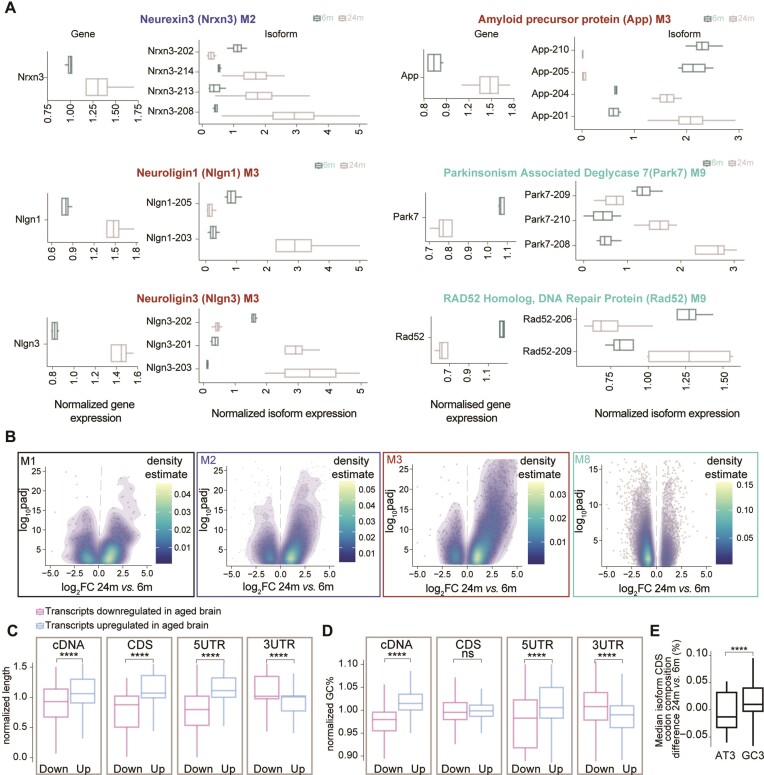
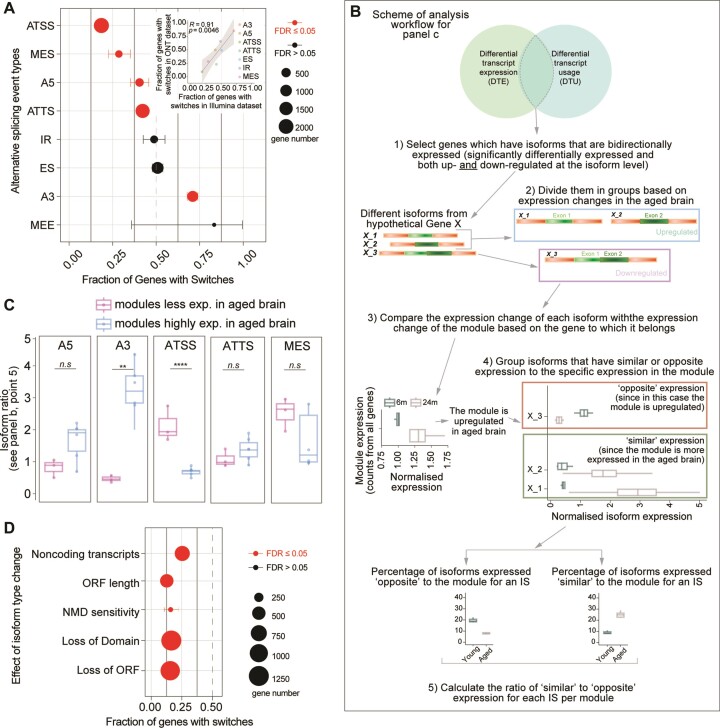
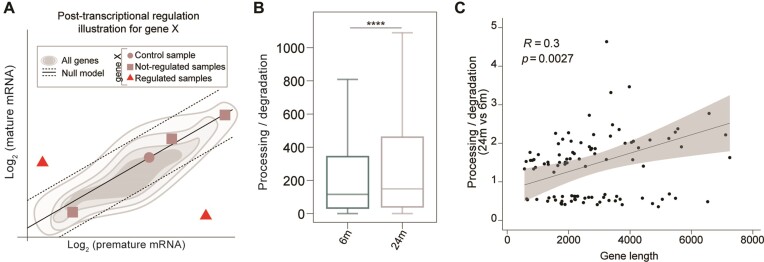
A comprehensive understanding of molecular changes during brain aging is essential to mitigate cognitive decline and delay neurodegenerative diseases. The interpretation of mRNA alterations during brain aging is influenced by the health and age of the animal cohorts studied. Here, we carefully consider these factors and provide an in-depth investigation of mRNA splicing and dynamics in the aging mouse brain, combining short- and long-read sequencing technologies with extensive bioinformatic analyses. Our findings encompass a spectrum of age-related changes, including differences in isoform usage, decreased mRNA dynamics and a module showing increased expression of neuronal genes. Notably, our results indicate a reduced abundance of mRNA isoforms leading to nonsense-mediated RNA decay and suggest a regulatory role for RNA-binding proteins, indicating that their regulation may be altered leading to the reshaping of the aged brain transcriptome. Collectively, our study highlights the importance of studying mRNA splicing events during brain aging.


Figures

Graphical Abstract
Graphical Abstract
Figure 1.
Figure 1.
Overview of the experimental outline and analysis workflow.
Figure 2.
Figure 2.
Gene expression changes in the aging mouse brain. (A) Volcano plot displaying the differentially expressed genes. Insets: dot plot for biological replicate variability calculated using PCA and correlation matrix (spearman ρ) of the Illumina short-read dataset. (B) STRING representation for the top 50 most down- or upregulated genes in the aged brain (respectively pink and light blue). Genes in bold were also identified in a specific synaptic gene ontology enrichment analysis (SynGO (82)), as also shown in the detailing inset where synaptic genes are categorized. (C–E) Gene ontology (GO)- Gene set enrichment analysis (GSEA) of genes that are significantly down- or upregulated in the aged brain (padj ≤ 0.05, |log2FC| ≥ 0.58), related to panel A.
Figure 3.
Figure 3.
Co-expression modules and association with cells and brain pathologies of the mouse aging transcriptome (A) WGNCA dendrogram with highlighted modules (lower colored bar). Genes were clustered based on a dissimilarity measure. The branches are modules of closely correlated gene groups. Nine significant modules and M0 corresponding to ∼16 000 genes were detected with WGCNA. M0 is a module with a less correlated gene group. (B) Module dissimilarity based on module eigengene distances. Modules are grouped based on their expression. (C) Boxplot of normalized mRNA expression in young and aged brains, grouped by their modules detected in the WGNCA method (paired t-test followed by Tukey posthoc test P-value * ≤ 0.05, ** ≤ 0.01, *** ≤ 0.001 and **** ≤ 0.0001). (DG) Gene ontology over-representation analysis (GO-ORA) for the four selected modules, respectively M1, M2, M3 and M8 shown here are top 5 GO terms based on the enrichment ratio. For all modules in detail refer to Supplementary Table S6. Circle sizes in the enrichment graphs correspond to the number of terms for each GO term, and color scales represent the padj. Insets are string network analysis for each module and their association with the respective pathways. For enlarged views of the string network analysis refer to Supplementary Figures S6–S9. (H) Dot plot of median mRNA expression from a previously published cell dataset. The size of the bubble represents the normalized overlap of the genes in the module with the specific cell type Supplementary Table S7). The color scale corresponds to the median expression for the overlapping genes. (I) Dot plot of the association of modules to brain pathologies. Lists have been manually curated for each pathology (Supplementary Table S8), the numbers are for overlap with all the genes in the short-read dataset, Alzheimer's disease (AD), amyotrophic lateral sclerosis (ALS), ataxia, autism, mental retardation (MR), and Parkinson disease (PD). The size of the bubble represents the log10P-value, and the color scale corresponds to the overlap ratio. The numbers in the bubble are the percentage of genes in each module for each pathology.
Figure 4.
Figure 4.
Isoform expression changes in the aging brain. (A) Boxplot of the normalized expression for a subselection of genes having isoforms that are expressed in an opposite manner when compared to the respective module. The panel on the left shows the gene expression while the right panels isoform expression. (B) Volcano density plots of significantly differentially expressed mRNA isoforms within selected modules from the WGCNA analysis that show interesting patterns during brain aging (M1, M2, M3 and M8). (C, D) Boxplot of the length (C) and GC% for different features (D) of an isoform. Genes were selected if they have at least 2 isoforms differentially expressed (padj ≤ 0.05 and |log2FC| ≥ |0.58|). Numbers were normalized for each gene and values of 1 would indicate equal distribution between age groups. (E) Boxplot of codon composition in the CDS for genes that were selected if they have at least two isoforms differentially expressed (padj ≤ 0.05 and |log2FC| ≥ |0.58|; paired t-test followed by Tukey posthoc test * ≤ 0.05, ** ≤ 0.01, *** ≤ 0.001 and **** ≤ 0.0001)
Figure 5.
Figure 5.
RNA splicing changes in the aging brain. (A) Alternative splicing events in the aging brain (FDR ≤ 0.05 are significant changes), inset: scatter plot summarizing the correlations of the short-read with the long-read dataset for each splicing type. Points represent the fraction of genes with switches for each functional category in the individual datasets (Pearson's P values). The significance test was performed using an exact binomial test followed by Benjamini-Hochberg adjustment (as this test is more accurate to study a variable that can take only two possible values; * ≤ 0.05, ** ≤ 0.01, *** ≤ 0.001 and **** ≤ 0.0001). (B) Workflow to compare the differentially used and expressed transcripts. (C) Isoform ratio as calculated in point 5 of panel B in figure. Modules are grouped depending on whether they are less expressed in the aged brain (M5, M7, M8) or more expressed (M1, M2, M3, M4, M6, M9) (unpaired t-test followed by Tukey posthoc test **** ≤ 0.0001). (d) Consequences of isoform types in the aging brain (FDR ≤ 0.05 are significant changes). The significance test is performed using the exact binomial test followed by Benjamini–Hochberg adjustment (* ≤ 0.05, ** ≤ 0.01, *** ≤ 0.001 and **** ≤ 0.0001).
Figure 6.
Figure 6.
Post-transcriptional mRNA regulations in the aging brain. (A) Cartoon illustrating the rationale behind the identification of the samples characterized by a post-transcriptional regulation of a hypothetical gene ‘X’. A linear model is fitted in the log2 (premature) – log2 (mature) space to recapitulate gene expression levels (gray shadows). The linear model is then translated to interpolate the control sample (dot). This leads to a gene-specific null model (black solid line). The samples not compatible with the null model (red triangles) would be evidence of a post-transcriptional regulation of a hypothetical gene ‘X’ while the other samples do not (squares). (B) Post-transcriptional ratio distributions in 6m and 24m mice (18638 expressed genes - Kolmogorov-Smirnov and paired Wilcoxon tests P-values **** ≤ 0.0001). (C) Pearson's coefficients summarizing the correlations of gene length to the estimated mRNA lifetime changes in the aged brain. Points represent the posttranscriptional ratio and gene length (Pearson's P-values).

Similar articles

Cited by

References

    1. López-Otín C., Blasco M.A., Partridge L., Serrano M., Kroemer G.. Hallmarks of aging: an expanding universe. Cell. 2023; 186:243–278. - PubMed
    1. Mattson M.P., Arumugam T.V.. Hallmarks of brain aging: adaptive and pathological modification by metabolic states. Cell Metab. 2018; 27:1176–1199. - PMC - PubMed
    1. Peters A. The effects of normal aging on myelin and nerve fibers: a review. J. Neurocytol. 2002; 31:581–593. - PubMed
    1. Ham S., Lee S.J.V.. Advances in transcriptome analysis of human brain aging. Exp. Mol. Med. 2020; 52:1787–1797. - PMC - PubMed
    1. Wyss-Coray T. Ageing, neurodegeneration and brain rejuvenation. Nature. 2016; 539:180. - PMC - PubMed