. 2024 May 22;52(9):5016-5032.
doi: 10.1093/nar/gkae175.

Viral reprogramming of host transcription initiation

Affiliations

Viral reprogramming of host transcription initiation

Nathan A Ungerleider et al. Nucleic Acids Res. .

Abstract

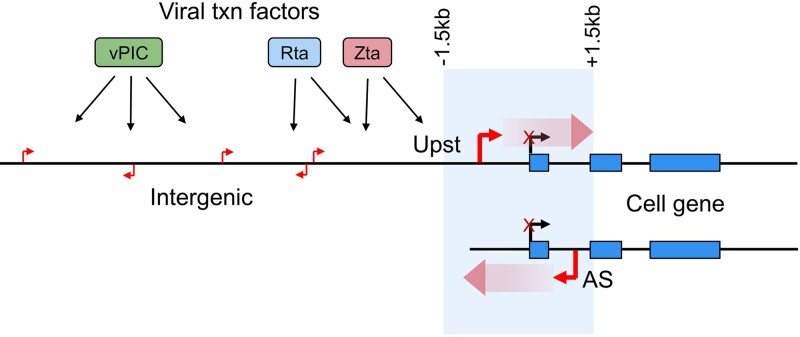
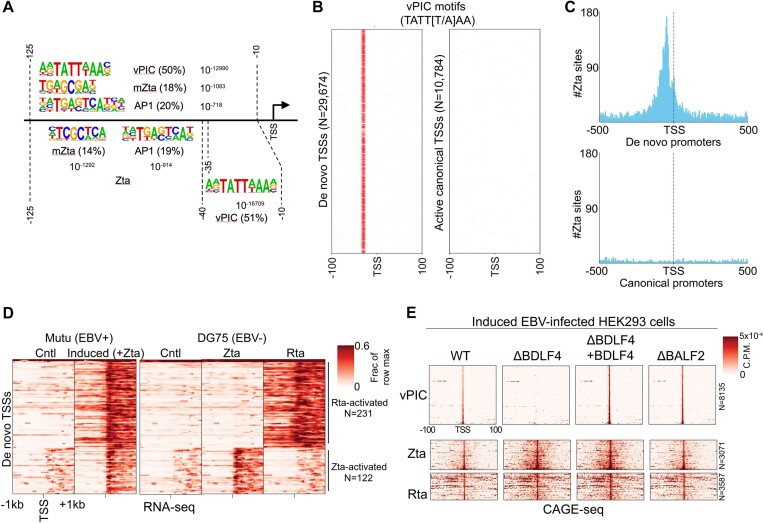
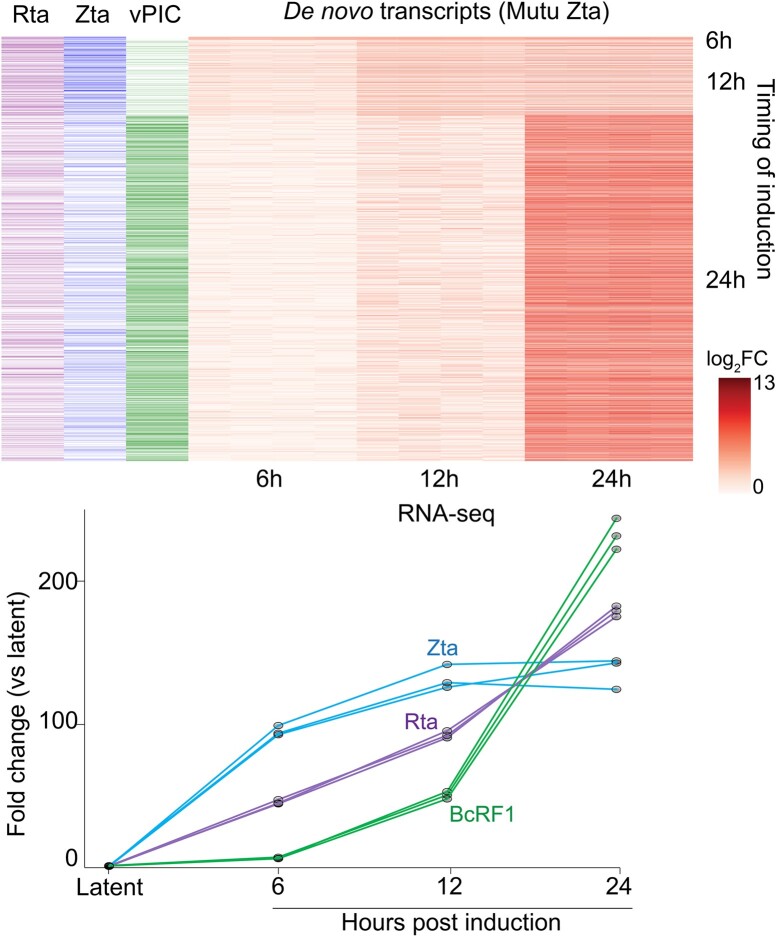
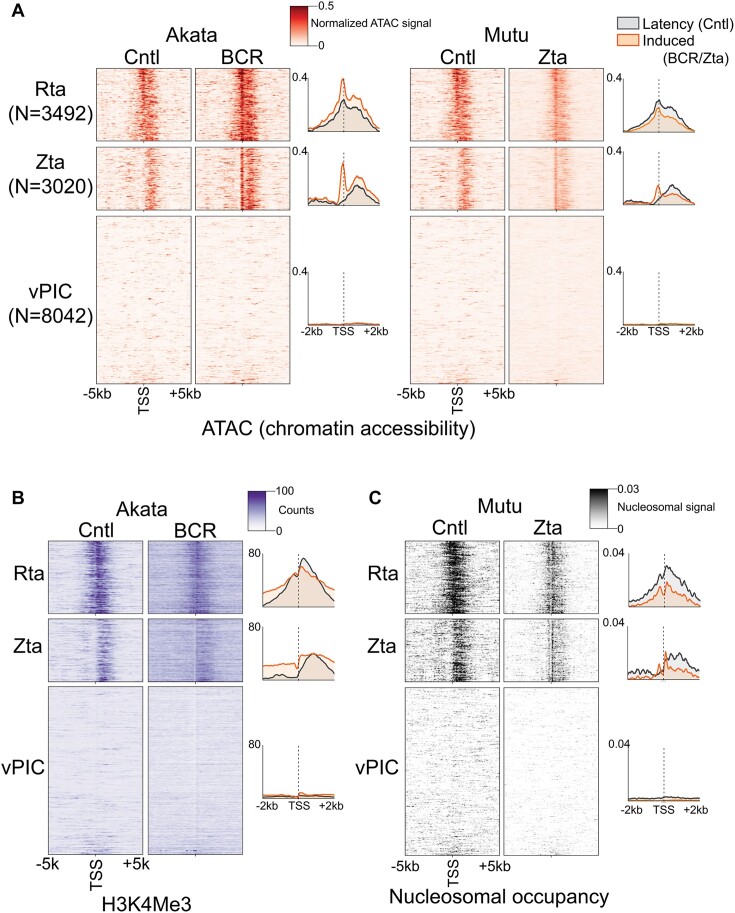
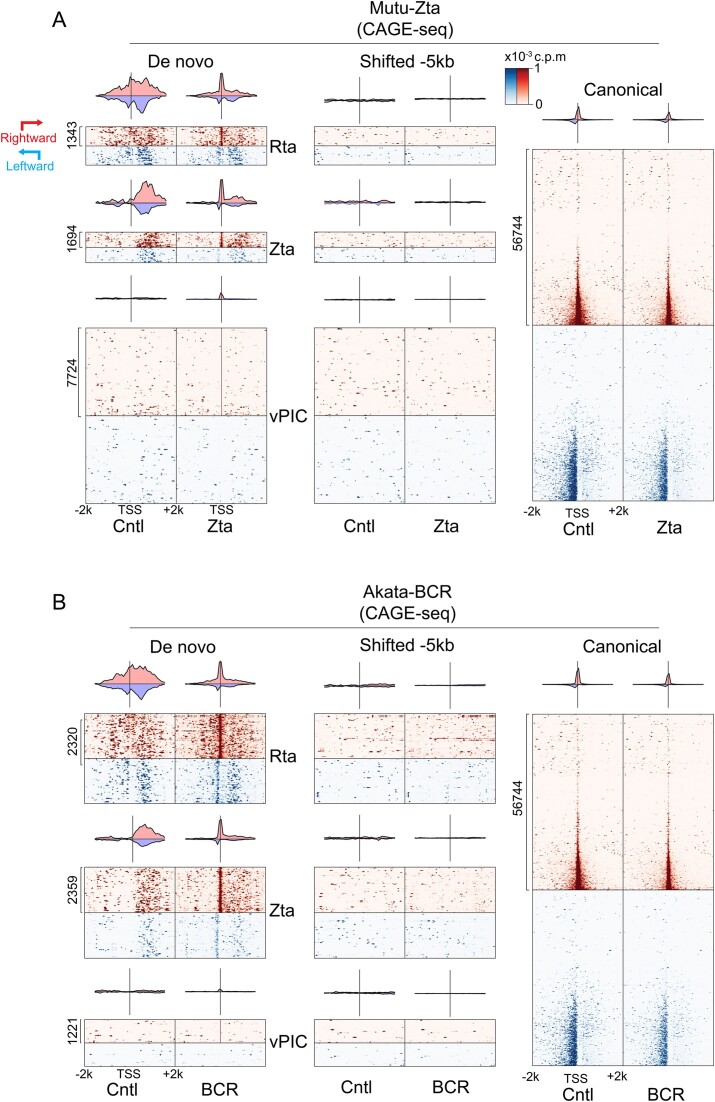
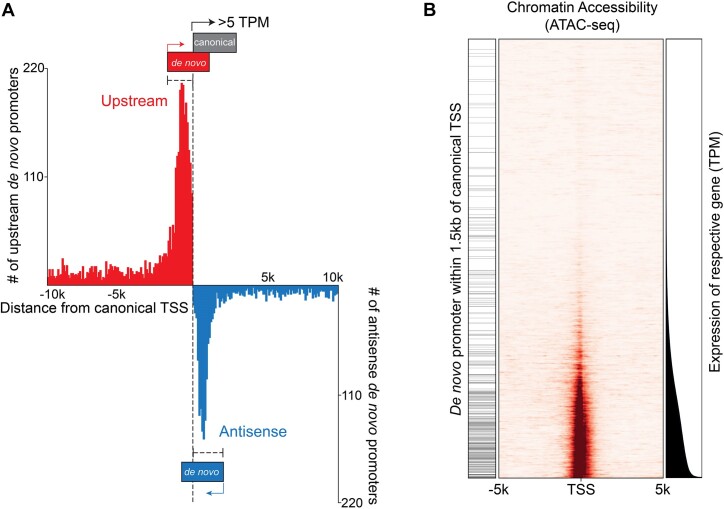
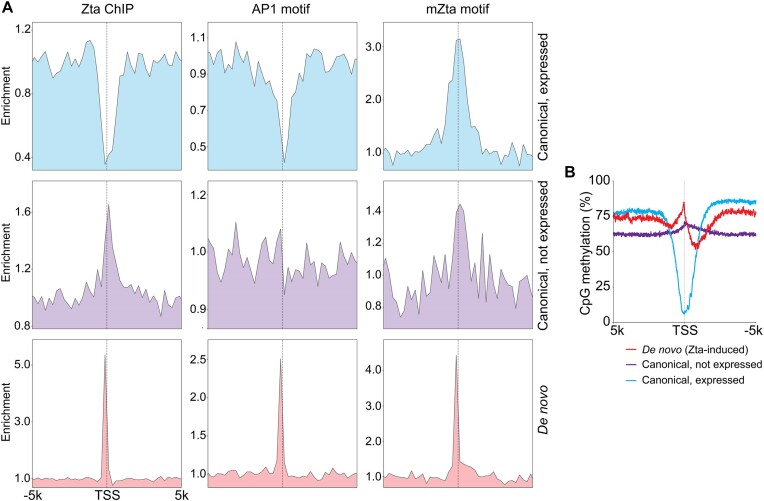
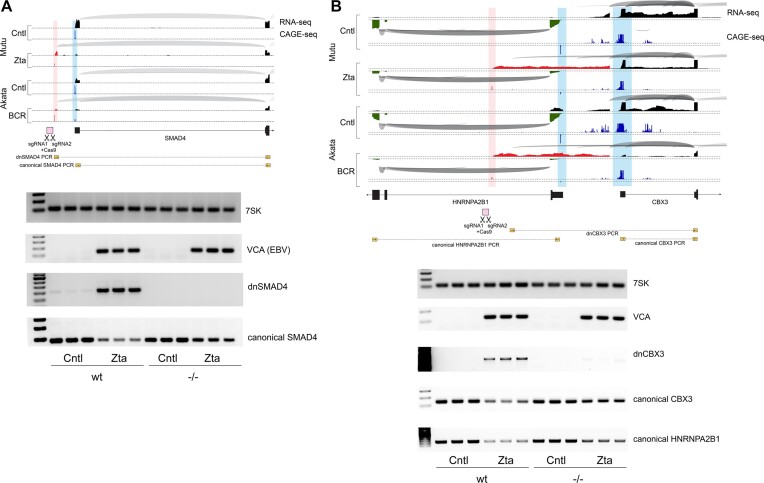
Viruses are master remodelers of the host cell environment in support of infection and virus production. For example, viruses typically regulate cell gene expression through modulating canonical cell promoter activity. Here, we show that Epstein Barr virus (EBV) replication causes 'de novo' transcription initiation at 29674 new transcription start sites throughout the cell genome. De novo transcription initiation is facilitated in part by the unique properties of the viral pre-initiation complex (vPIC) that binds a TATT[T/A]AA, TATA box-like sequence and activates transcription with minimal support by additional transcription factors. Other de novo promoters are driven by the viral transcription factors, Zta and Rta and are influenced by directional proximity to existing canonical cell promoters, a configuration that fosters transcription through existing promoters and transcriptional interference. These studies reveal a new way that viruses interact with the host transcriptome to inhibit host gene expression and they shed light on primal features driving eukaryotic promoter function.


Figures

Graphical Abstract
Graphical Abstract
Figure 1.
Figure 1.
Regulation of the cell transcriptome by EBV lytic replication. (A) The EBV positive Burkitt's lymphoma cell lines, Akata and Mutu, were transfected with the autonomously replicating pCEP4 plasmid containing the EBV early BMRF1 promoter upstream from a green fluorescent protein (GFP) reporter and stable transfectants were selected using hygromycin (upper panel). Stably transfected BMRF1p-GFP Akata or Mutu cells were left untreated or treated with anti-IgG or anti-IgM for 24 h. GFP+ cells were collected for the treated cells and GFP- cells were collected for the untreated cells. To induce reactivation directly through ectopic expression of the EBV transactivator, Zta, Mutu cells were co-transfected with a CMV-GFP reporter plasmid plus a control or an SV40p-Zta expression vector (lower panel) and GFP+ cells were collected for analyses. This panel was created with BioRender.com. (B) Mutu cells were co-transfected with a control or an SV40p-Zta expression vector plus either a CMV-GFP (left panel), a promoter-less GFP (middle panel), or a BMRF1p-GFP reporter plasmid (right panel) for 24 h and the percent GFP cells were counted. (C) Transcripts per million (TPM) values for Zta or the late gene, BLLF1, from RNA-seq analysis of 24 h Akata-BCR, Mutu-BCR or Mutu-Zta models. (D) Heatmap of log2(TPMlyt + 0.5/TPMlat + 0.5) values for common statistically significant changes across all three induction models.
Figure 2.
Figure 2.
EBV reactivation causes transcription initiation at novel, previously unannotated transcriptional start sites throughout the cell genome. (A–D) Plotting of splice junction reads (arches – thicker arches represent higher number of splice junction reads) and single base level coverage (height represents number of reads identified at each position) from RNA-seq data and CAGE-seq coverage (height represents number of reads starting at each position) in the Mutu-Zta and Akata-BCR models. Blue coverage/shading represents canonical transcription initiation and red coverage/shading represents ‘de novo’ transcription initiation. Exon structures of associated genes are indicated at the bottom of each plot. (E) Relative levels of RNA-seq read coverage mapping outside of annotated cell genes (i.e. de novo, dark matter transcription) in latency and reactivation across all three induction models. Y-values represent fraction of RNA-seq reads that map outside of or antisense to the start and end positions of annotated cell gene units relative to all reads mapping to the cell genome. (F) De novo start sites identified in either Mutu-Zta or Akata-BCR models were collated and used to plot heatmaps of RNA-seq read coverage spanning -1kb to plus 1kb from each de novo promoter start site (vertical axis). Coverages were normalized by row across all 6 sample groups.
Figure 3.
Figure 3.
De novo transcription is driven by viral transcription factors, vPIC (BcRF1), Zta, and Rta. (A) Motif analyses of regions upstream from de novo promoter start sites. The top three enriched motifs are shown for assessment of sequences between −125 and −10, the top two motifs are shown for assessment of sequences between −125 and −35 and the top motif is shown for sequences between −10 and −40. (B) Plotting of TATT[T/A]AA motifs across −100 to +100 bp from the de novo promoter start sites (left panel) and canonical/annotated start sites (right panel). Different start sites are positioned along the vertical axis. Positions with the TATT[T/A]AA motif are marked by a red line. (C) Plotting number of Zta binding sites from ChIP-seq (39) data with respect to de novo promoter start sites (left panel) and canonical (annotated) start sites (right panel). Counts are for number of Zta binding sites, using 5 bp bins. (D) Coverage heatmaps spanning −1 kb to +1 kb from start sites of de novo promoters found to be activated in DG75 cells transfected with either Zta or Rta (RNA-seq experiments). Corresponding heatmaps for respective de novo promoters in Mutu-Zta reactivation model shown for reference (left panel). The order of de novo regions on the y-axis is identical for each heatmap. Heatmap color intensity represents the mean signal of all replicates in each group. Positional coverage was normalized by row across both Mutu groups, and separately, across all DG75 cell sample groups. (E) CAGE-Seq plots of de novo TSSs from reactivated 293 cells infected with ΔBDLF4(vPIC factor), ΔBALF2 (DNA replication factor), or wildtype EBV (33).
Figure 4.
Figure 4.
Time course heatmap of fold change in expression of de novo transcripts (quantified based on coverage from +1 to +300 from de novo promoter TSS). De novo transcripts are arranged along the vertical axis and clustered according to timing of first detection (6, 12 and 24 h – right side of heatmap). To left of heatmap are marks indicating the presence of Rta consensus motifs (GNCCN[8–10]GGNG) within −200 to +1 of the start sites, Zta binding sites (ChIP-seq) within −200 and +40 of start sites, and TATT[T/A]AA motifs within −40 to −25 of the start sites. Fold change in the DNA binding factor of vPIC (BcRF1), Zta, and Rta are plotted based on quantification from RNA-seq data.
Figure 5.
Figure 5.
Zta and Rta (and ‘unclassified’, see Supplemental Figure S5) subclasses of de novo promoters are positioned upstream from chromatin features characteristic of active promoters. (A) Chromatin accessibility (alignment coverage from ATAC-seq data) is plotted for positions from −5 kb to +5 kb from the respective de novo promoter start sites in both latent (‘Cntl’) and reactivation conditions in the Akata-BCR and Mutu-Zta reactivation models. Heatmap color intensities represent processed coverage values (via TOBIAS ATACorrect (19); positional coverages were corrected for sequence bias and normalized using the ratio of reads in called peaks to total reads). (B) H3K4me3 histone mark coverage (from ChIP-seq data) is plotted for positions from −5 kb to +5 kb from the respective de novo promoter start sites in latent (‘Cntl’) and reactivation conditions in the Akata-BCR reactivation model. (C) Positioned nucleosomes (signal obtained using NucleoATAC analysis of ATAC-seq data) is plotted for positions from −5 kb to +5 kb from the respective de novo promoter start sites in both latent (‘Cntl’) and reactivation conditions in the Mutu-Zta reactivation model. The y-axis for each panel is sorted in ascending order according to the sum of all de novo CAGE-Seq counts across both Mutu and Akata cells. The order is identical in panels A to C.
Figure 6.
Figure 6.
Zta and Rta (and ‘unclassified’, see Supplemental Figure S6) subclasses of de novo promoters are positioned upstream from active promoters. Transcription start site coverage (from CAGE-seq data) is plotted for positions from −2 kb to +2 kb from the respective de novo promoter start sites in both latent (‘Cntl’) and reactivation conditions in the Mutu-Zta (A) and Akata-BCR (B) reactivation models. Start site coverage in the same direction as each de novo promoter is plotted in red while start site coverage on the opposite strand is plotted on blue. As a control, start site coverage with respect to positions −5 kb from the de novo promoter start sites are shown in middle panels. In addition, start site coverage with respect to annotated canonical promoters is shown as a reference (right panels). Heatmaps only include de novo start sites detected in the cell line plotted (for example, only de novo TSSs detected in reactivated Mutu cells were plotted in Figure 6A, B). For each cell line, the y-axis is arranged in ascending order by the sum of all CAGE-Seq reads at the de novo TSS. The order is the same in Cntl and reactivation conditions for panels A and B.
Figure 7.
Figure 7.
Enrichment of de novo promoters near expressed canonical promoters is dependent on canonical gene expression. (A) Histogram of upstream and antisense de novo promoters as a function of distance to canonical gene promoters. Counts are based on 200 bp bins. (B) Chromatin accessibility (middle panel) and expression levels (right panel) of annotated genes are plotted as a function of their respective expression levels (lowest to highest) in latent (‘Cntl’) Mutu cells. The left panel marks those annotated genes with a de novo promoter within 1.5 kb of the canonical gene TSS.
Figure 8.
Figure 8.
Basis for Zta binding outside of the body of active but not inactive canonical promoters. (A) Distribution of Zta binding (ChIP-seq) and AP1 and mZta motifs surrounding active (>3 TPM) and inactive (0 TPM) canonical promoters and the Zta class of de novo promoters. (B) Distribution of CpG methylation at active and inactive canonical promoters and de novo promoters in latent Mutu cells.
Figure 9.
Figure 9.
De novo transcription near canonical promoters cause transcriptional interference and suppression of cell gene expression. Upper panels show plots of splice junction reads (arches – thicker arches represent higher number of splice junction reads) and single base level coverage (height represents number of reads identified at each position) from RNA-seq data and CAGE-seq data (height represents number of reads identified at each position) in the Mutu-Zta and Akata-BCR models. Blue coverage/shading represents canonical transcription initiation and red coverage/shading represents ‘de novo’ transcription initiation. Exon structures of associated genes are indicated at the bottom of each plot. Lower panels show targeted deletions of de novo promoters proximal to SMAD4 (A) and HNRNPA2B1/CBX3 (B) canonical genes that were made in Mutu cells using CRISPR-Cas9 and two flanking sgRNAs (positions shown in upper panels). Knockout and wildtype cells were transfected with CMVp-GFP and SV40p-Zta or control vector and GFP + cells were isolated via FACS after 24 h. Gels are agarose gel electrophoresis of PCR fragments of the small RNA, 7SK, the viral late gene, VCA (BFRF3), the de novo transcript, and the canonical start site transcript for wild type cells and for de novo promoter knockout cells.

References

    1. Farrell P.J. Epstein-Barr virus and cancer. Annu. Rev. Pathol. 2019; 14:29–53. - PubMed
    1. Bjornevik K., Cortese M., Healy B.C., Kuhle J., Mina M.J., Leng Y., Elledge S.J., Niebuhr D.W., Scher A.I., Munger K.L. et al. . Longitudinal analysis reveals high prevalence of Epstein-Barr virus associated with multiple sclerosis. Science. 2022; 375:296–301. - PubMed
    1. Soldan S.S., Lieberman P.M. Epstein-Barr virus and multiple sclerosis. Nat. Rev. Micro. 2023; 21:51–64. - PMC - PubMed
    1. Hollingworth R., Grand R.J. Modulation of DNA damage and repair pathways by human tumour viruses. Viruses. 2015; 7:2542–2591. - PMC - PubMed
    1. Nikitin P.A., Luftig M.A. At a crossroads: human DNA tumor viruses and the host DNA damage response. Future Virol. 2011; 6:813–830. - PMC - PubMed

MeSH terms