. 2024 Mar 12;15(1):2235.
doi: 10.1038/s41467-024-45022-7.

Theileria parasites sequester host eIF5A to escape elimination by host-mediated autophagy

Affiliations

Theileria parasites sequester host eIF5A to escape elimination by host-mediated autophagy

Marie Villares et al. Nat Commun. .

Abstract

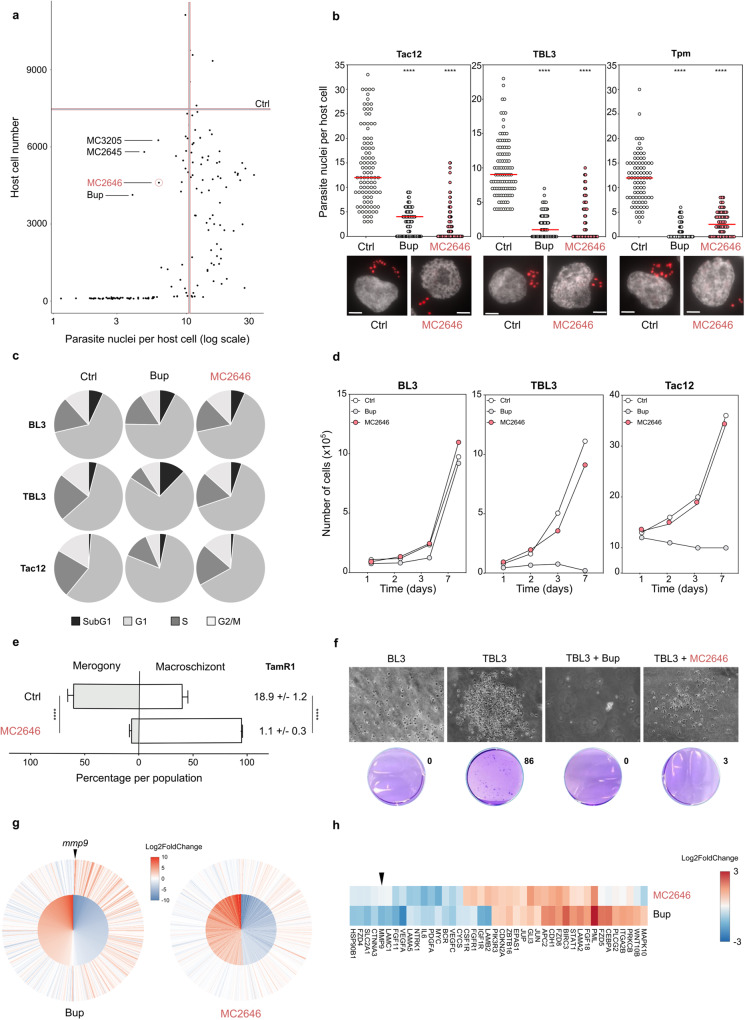
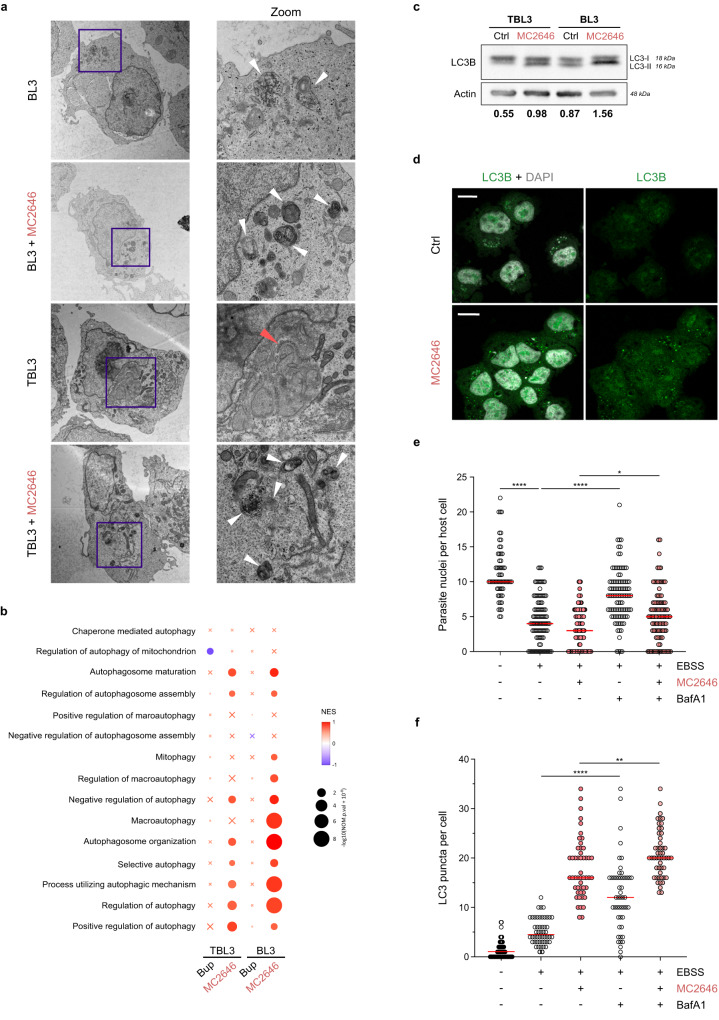
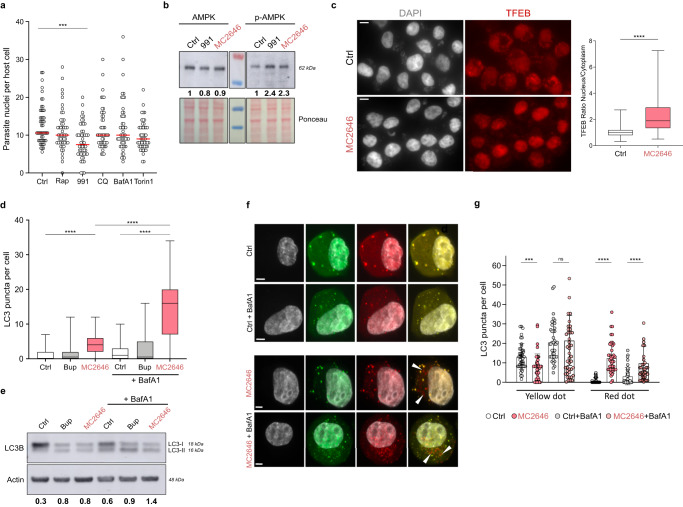
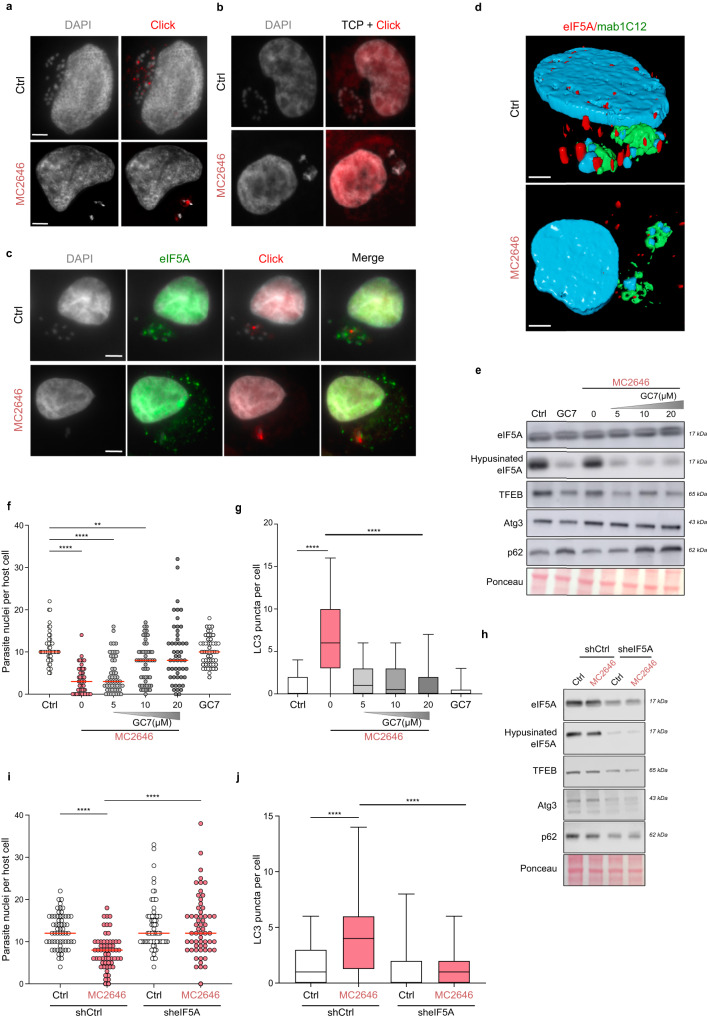
Intracellular pathogens develop elaborate mechanisms to survive within the hostile environments of host cells. Theileria parasites infect bovine leukocytes and cause devastating diseases in cattle in developing countries. Theileria spp. have evolved sophisticated strategies to hijack host leukocytes, inducing proliferative and invasive phenotypes characteristic of cell transformation. Intracellular Theileria parasites secrete proteins into the host cell and recruit host proteins to induce oncogenic signaling for parasite survival. It is unknown how Theileria parasites evade host cell defense mechanisms, such as autophagy, to survive within host cells. Here, we show that Theileria annulata parasites sequester the host eIF5A protein to their surface to escape elimination by autophagic processes. We identified a small-molecule compound that reduces parasite load by inducing autophagic flux in host leukocytes, thereby uncoupling Theileria parasite survival from host cell survival. We took a chemical genetics approach to show that this compound induced host autophagy mechanisms and the formation of autophagic structures via AMPK activation and the release of the host protein eIF5A which is sequestered at the parasite surface. The sequestration of host eIF5A to the parasite surface offers a strategy to escape elimination by autophagic mechanisms. These results show how intracellular pathogens can avoid host defense mechanisms and identify a new anti-Theileria drug that induces autophagy to target parasite removal.


Conflict of interest statement

All authors do not have any competing interests.

Figures

Fig. 1
Fig. 1. A compound screen identifies MC2646 which uncouples parasite survival from host survival.
a Screening of a library of 150 compounds (10 µM for 48 h) monitoring host cell number and parasite nuclei number. Graphical representation of parasite and host survival per well. The number of parasite nuclei and host cells in DMSO controls are indicated by vertical and horizontal lines, respectively. Treatment with Buparvaquone (Bup) or three others compounds (MC2645, MC2646, MC3205) reduced parasite survival. b Treatment of Theileria-infected cell lines (Tac12 infected macrophages, TBL3 infected B lymphocytes, and Tpm T. parva infected lymphocytes) with MC2646 or Buparvaquone (Bup) for 48 h, compared to untreated controls (Ctrl). Quantification and representative images showing parasite nuclei marked with parasite-specific histone H3K18me1 and DAPI. At least 50 host cells were counted per condition. One way-Anova, Dunnett’s multiple comparison test, ****p < 0.0001. Leica microscope x100 magnification; the scale bar corresponds to 5 µm. c Flow cytometry analysis of the cell cycle in uninfected B lymphocytes (BL3), infected lymphocytes (TBL3) or macrophages (Tac12) treated with Buparvaquone (Bup) or MC2646, compared to untreated controls (Ctrl). The percentage of G1, S phase, G2/M and sub-G1 populations are shown for each condition. Representative, flow cytometry data are shown in Supplementary Fig. 1b. d Growth curves of infected (TBL3 or Tac12) cells or uninfected (BL3) cells treated with Buparvaquone (Bup) or MC2646. Host cell viability was measured each day and compared to untreated controls (Ctrl). e MC2646 blocks parasite differentiation to merogony. Tac12 infected macrophages were incubated at 41 °C for 10 days (Ctrl) or treated with MC2646. Merogony was monitored visually and by the merogony marker gene TamR1 q-PCR analysis. Two-way Anova, Sidak’s multiple comparisons test, ****p < 0.0001. f MC2646 blocks the transformed phenotype. Colony growth in soft-agar assay was monitored for infected (TBL3) or uninfected (BL3) cells with or without (Ctrl) addition of MC2646 or Buparvaquone. g MC2646 treatment has a modest effect on the parasite-induced bovine transcriptome. Differential expression analysis of the RNA-Seq datasets; the inner circle shows the top 500 bovine genes most significantly (p-val adjusted) impacted by infection (TBL3 vs BL3) and the outer circle shows the effect of drug treatment for each gene. All genes are ordered by descending Log2 fold change (TBL3 vs BL3) for the 1st dataset. The color scale represents Log2Fc, as shown in the legend. The graph was plotted using ggplot2 (v3.3.6) in R v4.1.1. Differential statistical analysis with Weighted Kolmogorov-Smirnov Test. h Differential impact of MC2646 or Buparvaquone on expression of genes in the KEGG Pathways in Cancer geneset. Color scale represents Log2Fc. Genes not detected across datasets, as well as genes with sum absolute Log2Fc < 1.5 were omitted. The genes were then clustered with the Ward.D method, and plotted using pheatmap (v1.0.12). In all experiments (apart from Fig. 1a) cells were incubated with 50 ng/ml Buparvaquone or 1 µM MC2646. All results are representative of 3 independent experiments. Statistical analysis Dunnett’s multiple comparison test. ****p < 0.0001.
Fig. 2
Fig. 2. Treatment with the MC2646 compound restores host cell autophagy.
a Ultrastructural analysis by electron microscopy revealed classical autophagy-related organelle structures in uninfected BL3 cells, but a reduction of these structures in infected TBL3 cells. Treatment with MC2646 restored increased autophagosome in both cells. The electron micrographs are shown at a magnification of 2900x (left) and the highlighted blue box at 9300x (right). The white arrowheads highlight the autophagosome structures in BL3 cells and both cell types treated with MC2646. The red arrow highlights the annulate lamellae visible in infected cells. b Gene Signature Enrichment Analysis (GSEA) where color scale represents Normalized Enrichment Score (NES) and circle size represents p-value. Gene Ontology Biological Process (GOBP) genesets related to autophagy were used to compare the four RNA-Seq datasets: uninfected BL3 & infected TBL3, treated with Buparvaquone or MC2646, compared to the respective untreated dataset. Crosses indicate enrichment scores that are not statistically significant (FDR q-value > 0.25). The GSEA was evaluated with a Weighted Kolmogorov-Smirnov Test. c Analysis of LC3B protein in infected TBL3 and uninfected BL3 cells with or without MC2646 treatment. Western blots profiles show LC3-I and LC3-II forms which are restored in TBL3 cells after MC2646 treatment (4 µM, 24 h). The quantification of the ratio between LC3-II:LC3-I is indicated below. Actin was used as a loading control. d Infected TBL3 cells were untreated (Ctrl) or incubated with MC2646 (4 µM for 24 h) and LC3B-puncta were monitored by immunofluorescence (green). Host and parasite nuclei are indicated by DAPI staining. Leica microscope x63 magnification; the scale bar corresponds to 15 µm. e Autophagy induced by low-nutrient media reduced parasite survival. Infected TBL3 cells were incubated in EBSS media (4 h) and parasite load (determined by number of nuclei per host cell) was monitored. The addition of BafilomycinA1 (BafA1), blocks autophagic flux and rescued parasite survival. At least 50 host cells were counted per condition. Results are significant under Kruskal-Wallis followed by a Dunn’s multiple comparison test *p < 0.0191; ****p < 0.0001. f Quantification of LC3B puncta (same conditions as Fig. 2e). In all experiments cells were incubated with 50 ng/ml Buparvaquone or 4 µM MC2646 for 24 h. Results are representative of 3 independent experiments. Statistical analysis Dunnett’s multiple comparison test. *p < 0.1, ****p < 0.0001.
Fig. 3
Fig. 3. The compound MC2646 induces autophagy flux leading to parasite loss.
a Testing regulators of autophagy: infected TBL3 cells were incubated with Rapamycin (2 µM), 991 (4 µM), CQ (1 µM), BafA1 (1 µM), or Torin1 (1 µM) for 24 h. Parasite survival was monitored by counting nuclei in DAPI-stained images. At least 50 host cells were counted. Statistical 2-way Anova Dunn’s multiple comparison test. ***p = 0.0009. b Treatment of infected TBL3 cells with MC2646 or 991 compounds resulted in activation of the AMPK pathway (phosphorylation of Thr172, p-AMPK) detected by Western blot analysis. The relative quantification levels are indicated. c Infected TBL3 cells were treated with MC2646 and nuclear translocation of the transcription factor TFEB was monitored by immunofluorescence. The Nuclear:Cytoplasmic ratio was quantified for n = 50 cells. Statistical significance Mann-Whitney test two-tailed ****p < 0.0001. Leica microscope x63 magnification; the scale bar corresponds to 15 µm. d MC2646 induces LC3B puncta and autophagosomes formation. Infected TBL3 cells were incubated with Buparvaquone or MC2646 (24 h) and LC3B puncta were monitored by immunofluorescence. BafilomycinA1 (BafA1) was added (50 nM for 3 h) to block the autophagic flux. Statistical significance One way-Anova, Dunnett’s multiple comparison test, ****p < 0.0001. e The MC2646 compound induces autophagic flux. LC3B isoforms were monitored (same conditions as Fig. 3d) by Western blot analysis. Quantification corresponds to the LC3-II:LC3-I ratio standardized to the Actin control. f The MC2646 compound induces autophagic flux and fusion of autophagosomes and lysosomes. Immunofluorescence analysis of U2OS cells stably expressing a LC3-RFP-GFP reporter treated or not with MC2646 for 24 h. BafilomycinA1 was added (50 nM for 3 h). The red dots, indicating autophagosome induction by the MC2646 compound, are highlighted with white arrows. This is a representative experiment of the 3 that are shown quantitatively in Fig. 3g. Leica microscope x100 magnification; the scale bar corresponds to 5 µm. g Human uninfected U2OS cells expressing the LC3-RFP-GFP reporter plasmid treated with MC2646 and/or BafA1. Yellow puncta indicated the absence of autophagic flux, and red puncta fusion between autophagosomes and lysosomes. Statistical significance 2-way Anova Tukey’s multiple comparison test. At least 50 host cells were counted per condition. Error bar corresponds to the mean with SD. ***p < 0.0002; ****p < 0.0001. In all experiments, cells were incubated with 50 ng/ml Buparvaquone or 4 µM MC2646 for 24 h and/or BafA1 (50 nM for 3 h). Results are representative of 3 independent experiments. The boxplots in graphs indicate the 25% (bottom), 50% (center) and 75% quartiles (top). Whiskers represent the minimum (bottom) and the maximum (top).
Fig. 4
Fig. 4. The host eIF5A protein is sequestered at the parasite surface and released upon MC2646 treatment.
a The MC2646-click compound (MC4404) is localized in the vicinity of the parasite nuclei in the schizont. Microscopic images of infected TBL3 cells showing immunofluorescence of the MC2646 click compound (MC4404, Azide-Alexa Fluor 594, red) and DAPI-stained nuclei, with or without (Ctrl) MC2646 treatment. Leica microscope x100 magnification; the scale bar corresponds to 5 µm. b A control TCP-click compound did not localize to the parasite surface in the presence of absence of the MC2636 treatment. Microscopic images of infected TBL3 cells showing immunofluorescence of the Tranylcypromine click compound (Azide-Alexa Fluor 594, red) and DAPI-stained nuclei, with or without (Ctrl) MC2646 treatment. Leica microscope x100 magnification; the scale bar corresponds to 5 µm. c MC2646 treatment released eIF5A from the parasite schizont. We performed immunofluorescence analysis to localize eIF5A (Alexa Fluor 488, green) adjacent to parasite nuclei (DAPI), distinct from MC2646 click MC4404 (Azide-Alexa Fluor 594, red). The eIF5A was released from the schizont upon MC2646 treatment. Leica microscope x100 magnification; the scale bar corresponds to 5 µm. d Reconstructed 3D microscopy images of infected TBL3 cells stained with mab1C12 to mark the surface of the parasite macroschizont structure (green) and a specific anti-eIF5A antibody (red) in cells treated or not with MC2646 compound. The parasite and host nuclei are marked by DAPI staining (blue). The host eIF5A protein is recruited to the parasite surface in TBL3 cells and released upon MC2646 drug treatment. Leica microscope x100 magnification; the scale bar corresponds to 5 µm. e Inhibition of eIF5A hypusination. Infected TBL3 cells were treated with MC2646 with or without increasing concentration of the DHPS inhibitor GC7 and analysed by Western blot to monitor eIF5A, hypusinated eIF5A, TFEB, ATG3, and p62 proteins. Decreased eIF5A hypusination led to reduced TFEB and Atg3 levels and p62 accumulation. f Inhibition of eIF5A hypusination rescued parasite survival. Infected TBL3 cells were subjected to the above conditions (Fig. 4c) and monitored for parasite load by counting parasite nuclei per cell. At least 50 host cells were counted per condition (n = 3). Statistical significance One way-Anova, Dunnett’s multiple comparison test, **p < 0.014; ****p < 0.0001. g Inhibition of eIF5A hypusination reversed autophagic flux. Infected TBL3 cells were subjected to the above conditions (Fig. 3c) and monitored for LC3B puncta by immunofluorescence. At least 50 host cells were counted per condition. Results are significant under Kruskal-Wallis followed by a Dunn’s multiple comparison test ****p < 0.0001. h Effect of eIF5A depletion. Tac12 infected macrophages expressing stable sh_eIF5A (compared to control sh_Ctrl) were analysed by Western blot upon MC2646 treatment. eIF5A knockdown resulted in reduced levels of TFEB, ATG3, and p62. At least 50 host cells were counted per condition. Results are significant under Kruskal-Wallis followed by a Dunn’s multiple comparison test ****p < 0.0001. i eIF5A depletion rescued parasite survival. Tac12 cells expressing sh_eIF5A showed restored parasite load (parasite nuclei per host cell) upon MC2646 treatment. At least 50 host cells were counted per condition. Results are significant under Kruskal-Wallis followed by a Dunn’s multiple comparison test ****p < 0.0001. j eIF5A depletion blocked autophagosome formation. Immunofluorescence analysis of Tac12 cells expressing sh_eIF5A showed reduced LC3B puncta in the presence of MC2646 drug. At least 50 host cells were counted per condition. Results are significant under Kruskal-Wallis followed by a Dunn’s multiple comparison test ****p < 0.0001. In all experiments, cells were incubated with 50 ng/ml Buparvaquone or 4 µM MC2646 for 24 h and/or BafA1 (50 nM for 3 h). Results are representative of 3 independent experiments. Statistical analysis Dunnett’s multiple comparison test. **p < 0.01, ****p < 0.0001. The boxplots in graphs indicate the 25% (bottom), 50% (center) and 75% quartiles (top). Whiskers represent the minimum (bottom) and the maximum (top).

Similar articles

Cited by

References

    1. Villares M, Berthelet J, Weitzman JB. The clever strategies used by intracellular parasites to hijack host gene expression. Semin. Immunopathol. 2020;42:215–226. doi: 10.1007/s00281-020-00779-z. - DOI - PubMed
    1. Yarovinsky F. Innate immunity to Toxoplasma gondii infection. Nat. Rev. Immunol. 2014;14:109–121. doi: 10.1038/nri3598. - DOI - PubMed
    1. Tretina K, Gotia HT, Mann DJ, Silva JC. Theileria-transformed bovine leukocytes have cancer hallmarks. Trends Parasitol. 2015;31:306–314. doi: 10.1016/j.pt.2015.04.001. - DOI - PubMed
    1. Cheeseman K, Weitzman JB. Host-parasite interactions: an intimate epigenetic relationship. Cell. Microbiol. 2015;17:1121–1132. doi: 10.1111/cmi.12471. - DOI - PubMed
    1. Woods K, Perry C, Brühlmann F, Olias P. Theileria’s strategies and effector mechanisms for host cell transformation: from invasion to immortalization. Front. Cell Dev. Biol. 2021;9:662805. doi: 10.3389/fcell.2021.662805. - DOI - PMC - PubMed