. 2024 Mar 12;15(1):2236.
doi: 10.1038/s41467-024-45628-x.

Inhalation of ACE2-expressing lung exosomes provides prophylactic protection against SARS-CoV-2

Affiliations

Inhalation of ACE2-expressing lung exosomes provides prophylactic protection against SARS-CoV-2

Zhenzhen Wang et al. Nat Commun. .

Abstract

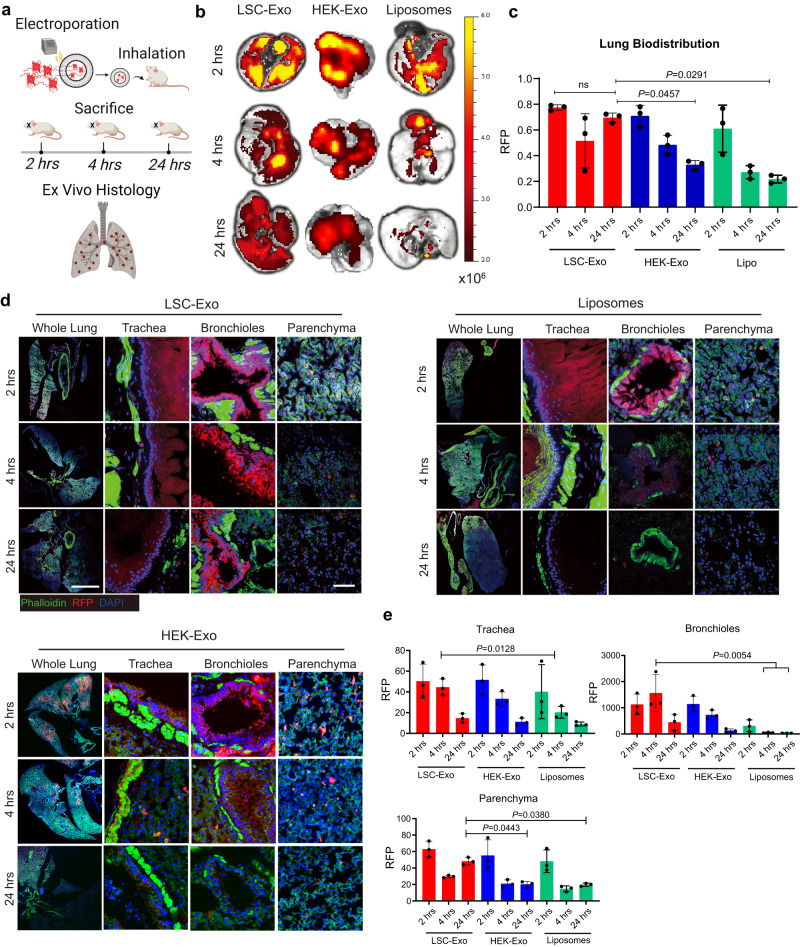
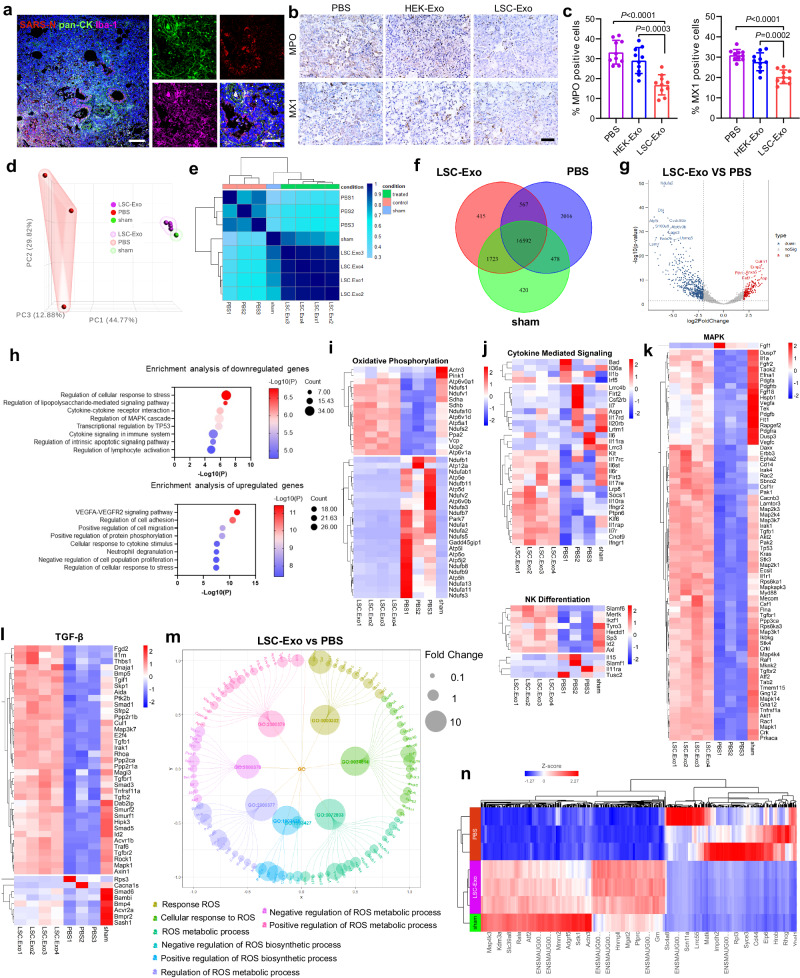
Continued emergence of SARS-CoV-2 variants of concern that are capable of escaping vaccine-induced immunity highlights the urgency of developing new COVID-19 therapeutics. An essential mechanism for SARS-CoV-2 infection begins with the viral spike protein binding to the human ACE2. Consequently, inhibiting this interaction becomes a highly promising therapeutic strategy against COVID-19. Herein, we demonstrate that ACE2-expressing human lung spheroid cells (LSC)-derived exosomes (LSC-Exo) could function as a prophylactic agent to bind and neutralize SARS-CoV-2, protecting the host against SARS-CoV-2 infection. Inhalation of LSC-Exo facilitates its deposition and biodistribution throughout the whole lung in a female mouse model. We show that LSC-Exo blocks the interaction of SARS-CoV-2 with host cells in vitro and in vivo by neutralizing the virus. LSC-Exo treatment protects hamsters from SARS-CoV-2-induced disease and reduced viral loads. Furthermore, LSC-Exo intercepts the entry of multiple SARS-CoV-2 variant pseudoviruses in female mice and shows comparable or equal potency against the wild-type strain, demonstrating that LSC-Exo may act as a broad-spectrum protectant against existing and emerging virus variants.


Conflict of interest statement

J.L. is an employee of Xsome Biotech Inc. K.C. is a co-founder and equity holder of Xsome. Xsome provided no funding to the study. No other authors declare competing interests.

Figures

Fig. 1
Fig. 1. Characterization of LSC-Exo and surface expression of ACE2 on LSC-Exo.
a Extraction scheme of LSC and LSC-Exo from healthy donors, created with Biorender.com. b Immunofluorescence staining and quantification analysis of ACE2 on LSC and HEK. Scale bar: 50 μm. n = 3. c Western blot quantification of ACE2 expression in LSC and HEK, which derived from the same experiments and processed in parallel. n = 3. d Representative TEM images of LSC-Exo and HEK-Exo from 3 independent experiments. Scale bar: 100 μm. e Measurements of size distribution of LSC-Exo and HEK-Exo via nanoparticle tracking analysis. Inset: 3-colar dSTORM image of CD63-Alexa Fluor®-488, PE-CD9, APC-CD81 of LSC-Exo or HEK-Exo. f Quantification of ACE2 expression on LSC-Exo and HEK-Exo by flow cytometry. n = 3. Gating strategy was shown in Fig. S20a. g Western blot and quantification analysis of ACE2 levels on LSC-Exo and HEK-Exo. This quantification analysis derived from the same experiments. n = 3. Data are mean ± s.d. A two-tailed, unpaired Student’s t-test was performed for statistical analysis. Source data are provided as a Source Data file.
Fig. 2
Fig. 2. RFP-loaded LSC-Exo has superior distribution in mouse lung.
a Study scheme of RFP-Exo’s distribution in mice, created with Biorender.com. b 2, 4 and 24 h ex-vivo imaging of mouse lungs after RFP-Exo, RFP-HEK or RFP-Lipo nebulization. c Quantitative results of RFP intensity in ex-vivo mouse lungs; n = 3. d Representative immunostaining images for whole lung, trachea, bronchioles, and parenchyma. Exosomes (red) or liposomes (red), phalloidin (green) and DAPI (blue). Scale bar, 1000 μm for whole lung, 100 μm for parenchyma. e Quantification results of RFP fluorescence density in trachea, bronchioles, and parenchyma; n = 3 per group. Data are mean ± s.d. The one-way ANOVA with Bonferroni correction was performed for statistical analysis. Source data are provided as a Source Data file.
Fig. 3
Fig. 3. LSC-Exo prevents the entry of SARS-CoV-2 pseudovirus.
a Biolayer interferometry assay of the binding LSC-Exo or HEK-Exo or rhACE2 to RBD. The left panel was created with Biorender.com. b ELISA analysis of the binding affinity between rhACE2 with RBD in the presence of LSC-Exo or HEK-Exo. n = 3. c Schematic depiction of cell-based neutralization assay, created with Biorender.com. d SARS-CoV-2 WA1 pseudovirus neutralization analysis of LSC-Exo, HEK-Exo, or rhACE2 in A549 cells expressing ACE2, determined by GFP fluorescence intensity. n = 3. e The neutralization potency of LSC-Exo determined by SARS-CoV-2 WA1 pseudovirus neutralization analysis. n = 3. f Flow plots of SARS-CoV-2 WA1 pseudovirus-infected A549 cells that inhibited by LSC-Exo, HEK-Exo, or rhACE2 and its corresponding quantification analysis. n = 3. Gating strategy was shown in Fig. S20b. g Animal study design of the protection of LSC-Exo against SARS-CoV-2 WA1 pseudovirus with a GFP reporter, created with Biorender.com. h Ex-vivo imaging and quantification analysis of lung from mice inoculated with SARS-CoV-2 WA1 pseudovirus. n = 3. i Immunostaining images of whole lung of mice for DAPI (blue), phalloidin (red), and SARS-CoV-2 WA1 pseudovirus (green). Scale bar: 50 μm. Quantification analysis of GFP reporter signals in trachea/bronchioles (j) and parenchyma (k). n = 10 images from 5 hamsters. Data are mean ± s.d. Statistical analysis was performed by two-way ANOVA with Tukey’s multiple comparisons (d) or one-way ANOVA with Bonferroni correction (f, h, j, k). Source data are provided as a Source Data file.
Fig. 4
Fig. 4. Protective effect of LSC-Exo against authentic SARS-CoV-2 infection in Syrian hamsters.
a Time courses of LSC-Exo inhalation, viral challenge, and measurements, created with Biorender.com. b Changes in body weight of hamsters over 1-week post-challenge. n = 4. c Viral RNA in oral swabs (OS) from hamsters treated with LSC-Exo, HEK-Exo or PBS. n = 5. d Viral RNA in bronchoalveolar lavage (BAL) fluid from hamsters treated with LSC-Exo, HEK-Exo or PBS at 7 days post-challenge. n = 5. e RNAscope images revealing regional distribution and viral RNA levels in hamster lungs. Immunohistochemistry analysis of SARS-N protein in lung tissues of hamsters. Scale bar, 50 μm. f Quantification analysis of positive SARS-N cell percentages in lungs of hamster. n = 15. g H&E images of representative lung sections of hamsters. n = 5 animals per group. Three images were taken for each animal. Scale bar, 500 μm. h Masson’s trichrome staining of lung sections of hamsters. n  =  5 animals per group. Three images were taken for each animal. Scale bar, 500 μm. i Ashcroft scoring analysis of lung fibrosis from challenged hamsters that performed blindly. n = 5. j Spider web plot displaying histopathological scoring of lung damage, normalized to sham control (green). Viral genomic RNA levels (k) and sgRNA levels (l) in tissues of hamsters with PBS, HEK-Exo or LSC-Exo treatment (purple, PBS; blue, HEK-Exo; and red, LSC-Exo). n = 5. Data are mean ± s.d. Statistical analysis was performed by two-way ANOVA with Tukey’s multiple comparisons (b, c, k, l) or one-way ANOVA with Bonferroni correction (d, f, i). Source data are provided as a Source Data file.
Fig. 5
Fig. 5. Protective mechanisms of LSC-Exo against SARS-CoV-2 infection.
a Representative SARS-N (red), pan-CK (green), Iba-1 (purple) and DAPI (blue) staining for lung tissues of hamsters. Scale bar, 50 μm. b Representative MPO and MX1 immunohistochemistry images from the lung sections of hamsters. Scale bar, 50 μm. c Quantification analysis of MPO and MX1 positive cells in hamster lungs. n = 10. Data are mean ± s.d. d Principal component analysis (PCA) comparing the transcriptome of sham hamster and infected hamsters treated with PBS or LSC-Exo. e Sample clustering based on Pearson’s correlation of transcriptomes in lung tissues from sham, PBS and LSC-Exo group. f Venn diagram of the gene profiles between Sham, PBS and LSC-Exo groups. g Volcano plots displaying of differential gene expression from LSC-Exo versus PBS group with Padj < 0.05, and an absolute value of log2 fold change (FC) > 1 (red, upregulated genes; blue, downregulated genes). n = 3 for PBS group and n = 4 for LSC-Exo group. h Gene Ontology (GO) enrichment analysis of downregulated and upregulated genes from comparisons of infected hamsters treated with LSC-Exo versus PBS. Heatmaps of expression levels of candidate genes in oxidative phosphorylation (i), cytokine mediated signaling and NK differentiation (j), MAPK pathway (k) and TGF-β pathway (l) from the LSC-Exo, PBS and sham groups. m Functionally grouped network of enriched ROS-related categories. Each cluster is represented by a different color. n Heat map showing the differential gene expression of LSC-Exo vs PBS vs Sham. Statistical analysis was measured by one-way ANOVA with Bonferroni correction (c) or two-tailed Wald test with Benjamini–Hochberg correction for multiple comparisons (g, h). Source data are provided as a Source Data file.
Fig. 6
Fig. 6. LSC-Exo prevents the infection of SARS-CoV-2 D614G and B.1.617.2 (Delta) pseudoviruses.
a Flow cytometry of A549 cells infected with SARS-CoV-2 D614G pseudovirus, which were inhibited by LSC-Exo, HEK-Exo or rhACE2 treatment and the corresponding quantification analysis (b). n = 3. Gating strategy was shown in Fig. S20b. c Flow cytometry of SARS-CoV-2 B.1.617.2 (Delta) pseudovirus-infected A549 cells treated with LSC-Exo, HEK-Exo or rhACE2 and its corresponding quantification analysis (d). n = 3. Gating strategy was same with Fig. S20b. e Ex vivo IVIS imaging of infected lungs from mice with SARS-CoV-2 D614G or B.1.617.2 (Delta) pseudovirus challenge. rhACE2 or HEK-Exo or LSC-Exo was inhaled at 2 h before challenge. f Quantitative fluorescence intensity of SARS-CoV-2 D614G or B.1.617.2 (Delta) pseudoviruses from Fig. 6e. n = 3. Confocal images to show the distribution of SARS-CoV-2 D614G pseudovirus (g) and B.1.617.2 (Delta) pseudovirus (h) in whole lung tissues from the mice with LSC-Exo or HEK-Exo or rhACE2 treatment. Scale bar: 100 μm. Quantitative of pseudoviruses positive signals in both trachea/bronchioles and parenchyma from mice challenged with D614G (i) or B.1.617.2 (Delta) (j) pseudovirus. n = 10 images from 5 hamsters. k Cytokine array to determine inflammatory cytokines from mice serum 7 days after LSC-Exo inhalation. Data are mean ± s.d. One-way ANOVA with Bonferroni correction was performed for statistical analysis. Source data are provided as a Source Data file.

References

    1. Sohrabi C, et al. World Health Organization declares global emergency: a review of the 2019 novel coronavirus (COVID-19) Int. J. Surg. 2020;76:71–76. doi: 10.1016/j.ijsu.2020.02.034. - DOI - PMC - PubMed
    1. Klasse PJ, Nixon DF, Moore JP. Immunogenicity of clinically relevant SARS-CoV-2 vaccines in nonhuman primates and humans. Sci. Adv. 2021;7:eabe8065. doi: 10.1126/sciadv.abe8065. - DOI - PMC - PubMed
    1. Sahin U, et al. BNT162b2 vaccine induces neutralizing antibodies and poly-specific T cells in humans. Nature. 2021;595:572–577. doi: 10.1038/s41586-021-03653-6. - DOI - PubMed
    1. Mlcochova P, et al. SARS-CoV-2 B.1.617.2 Delta variant replication and immune evasion. Nature. 2021;599:114–119. doi: 10.1038/s41586-021-03944-y. - DOI - PMC - PubMed
    1. Saito A, et al. Enhanced fusogenicity and pathogenicity of SARS-CoV-2 Delta P681R mutation. Nature. 2022;602:300–306. doi: 10.1038/s41586-021-04266-9. - DOI - PMC - PubMed

Substances

Supplementary concepts