. 2024 Mar 12;15(1):2243.
doi: 10.1038/s41467-024-46630-z.

A single nuclear transcriptomic characterisation of mechanisms responsible for impaired angiogenesis and blood-brain barrier function in Alzheimer's disease

Affiliations

A single nuclear transcriptomic characterisation of mechanisms responsible for impaired angiogenesis and blood-brain barrier function in Alzheimer's disease

Stergios Tsartsalis et al. Nat Commun. .

Abstract

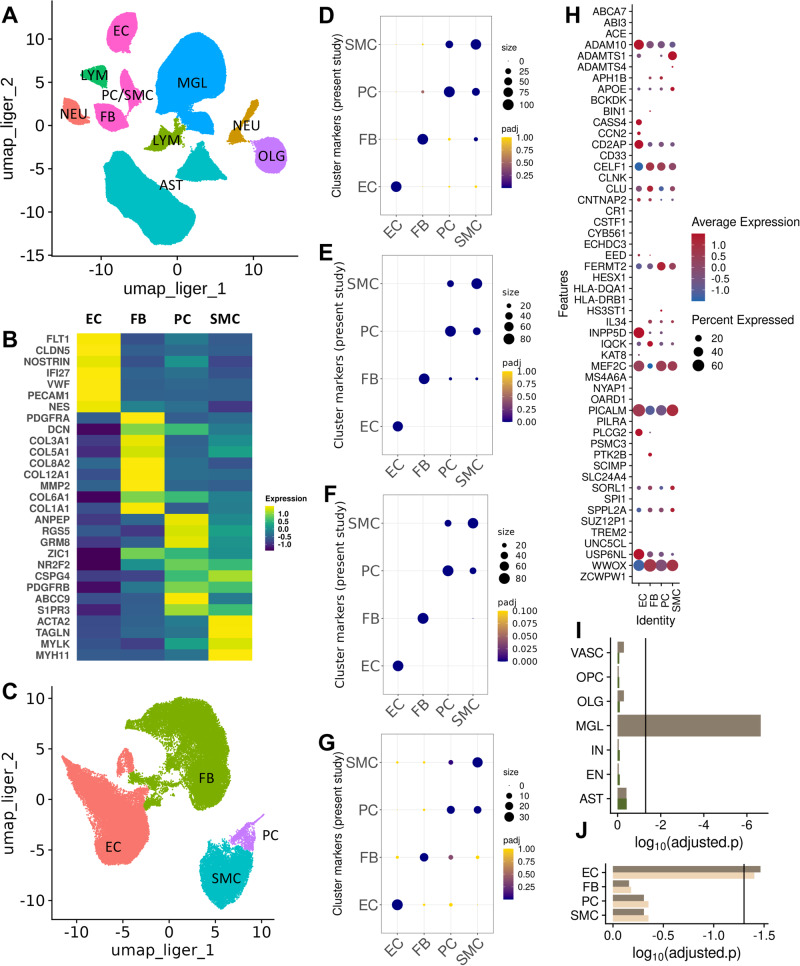
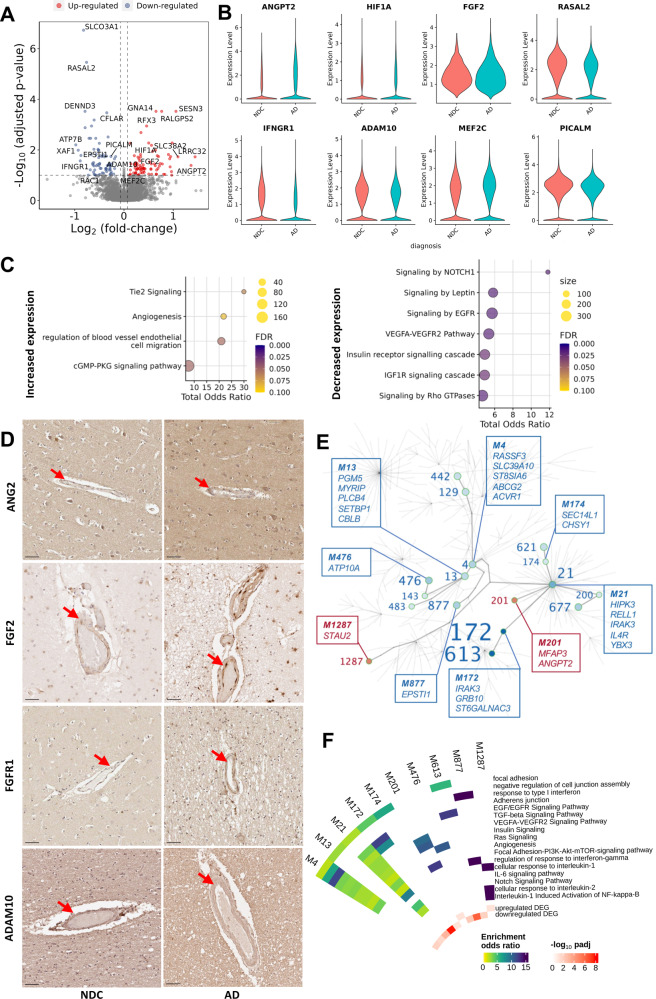
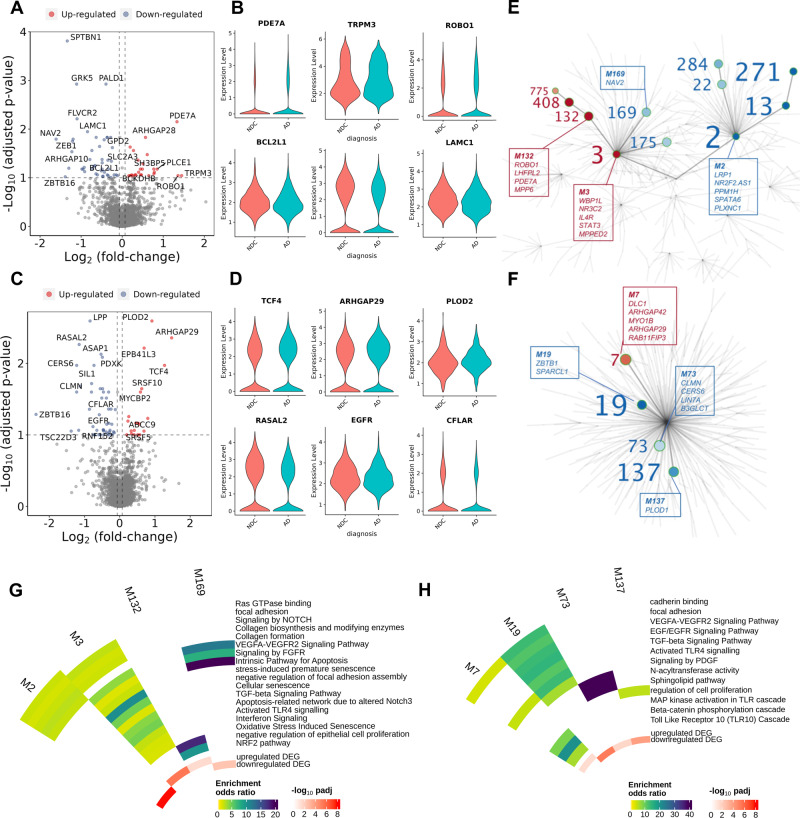
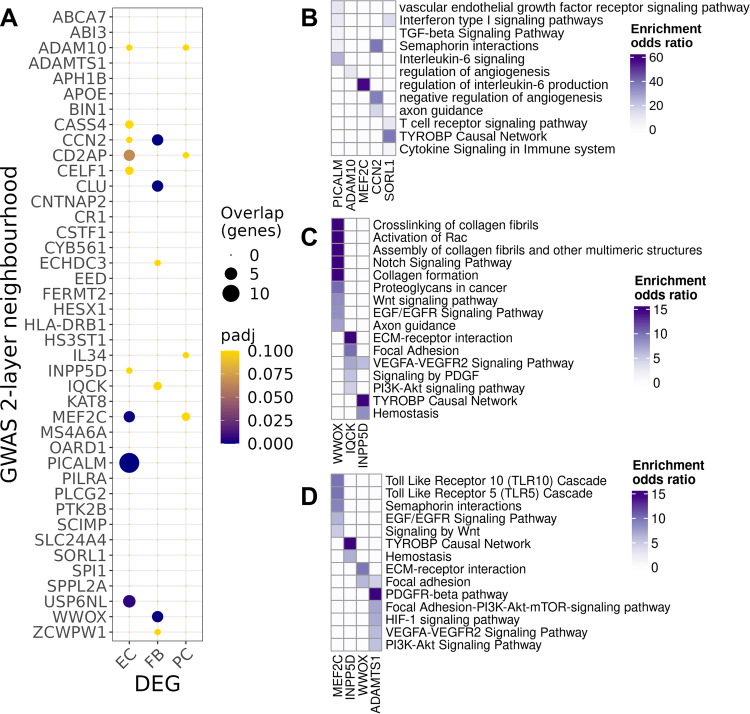
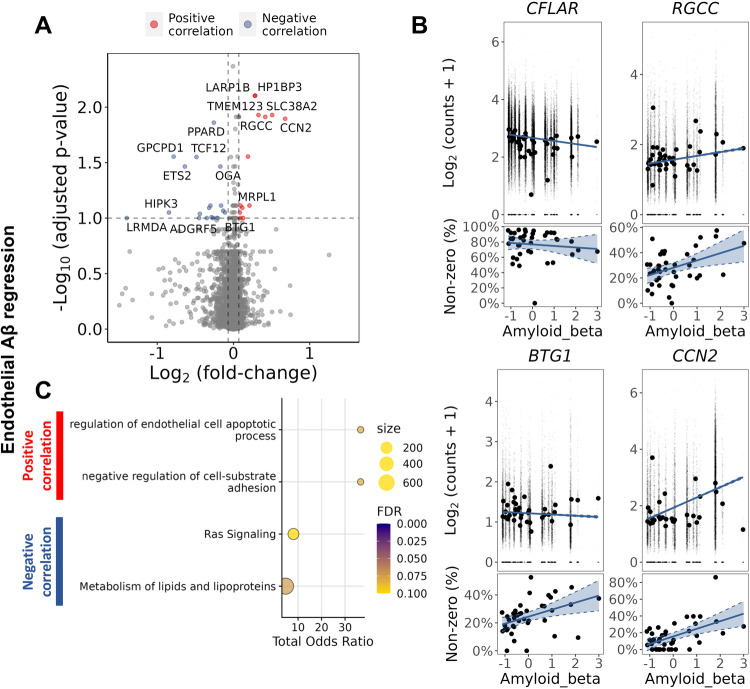
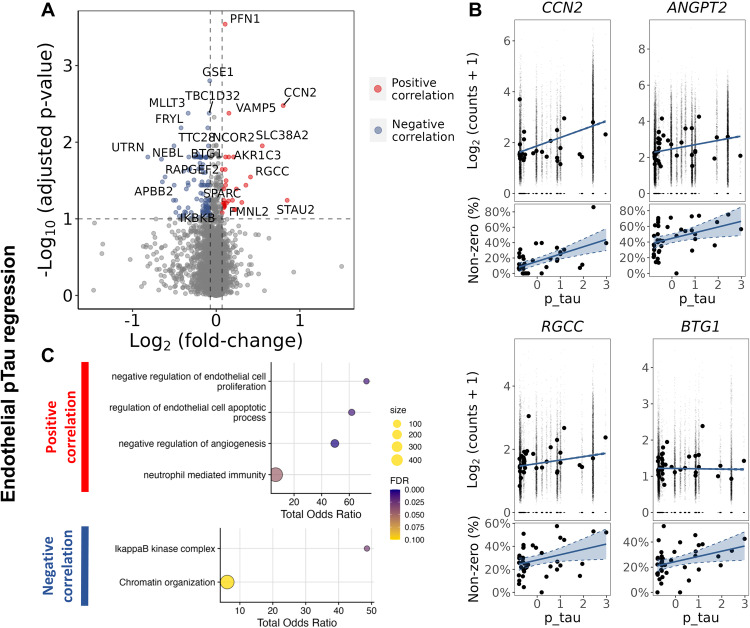
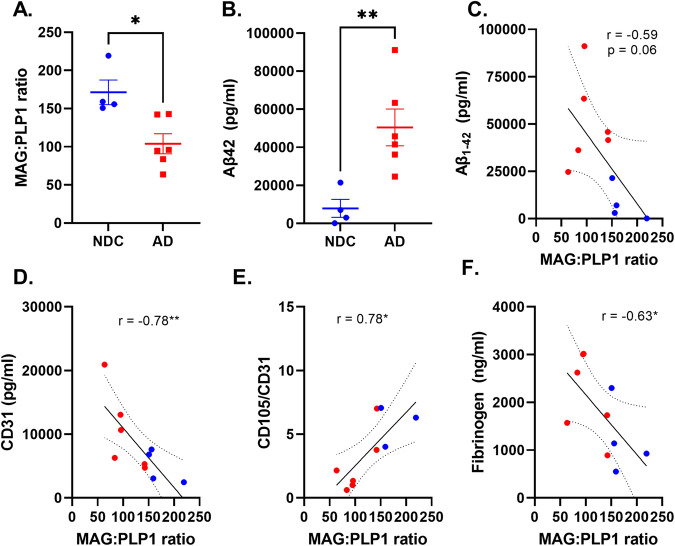
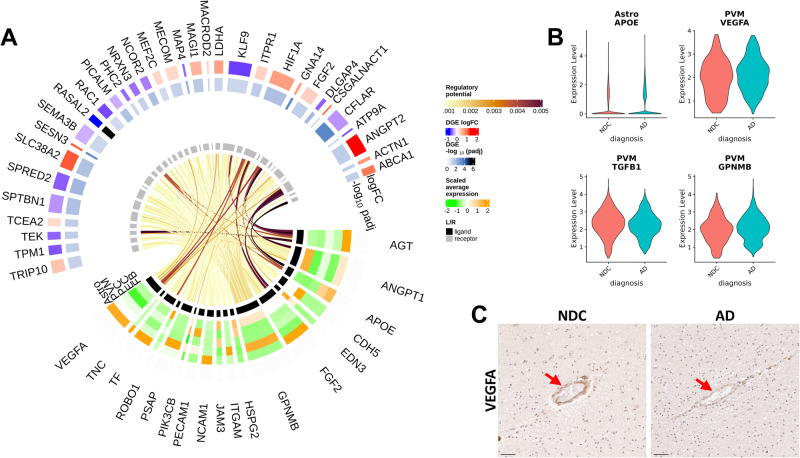
Brain perfusion and blood-brain barrier (BBB) integrity are reduced early in Alzheimer's disease (AD). We performed single nucleus RNA sequencing of vascular cells isolated from AD and non-diseased control brains to characterise pathological transcriptional signatures responsible for this. We show that endothelial cells (EC) are enriched for expression of genes associated with susceptibility to AD. Increased β-amyloid is associated with BBB impairment and a dysfunctional angiogenic response related to a failure of increased pro-angiogenic HIF1A to increased VEGFA signalling to EC. This is associated with vascular inflammatory activation, EC senescence and apoptosis. Our genomic dissection of vascular cell risk gene enrichment provides evidence for a role of EC pathology in AD and suggests that reducing vascular inflammatory activation and restoring effective angiogenesis could reduce vascular dysfunction contributing to the genesis or progression of early AD.


Conflict of interest statement

P.M.M. is a consultant for Biogen, Sudo Therapeutics, Nimbus, Astex, GSK and Sangamo. He has received research funding for aspects of this work from Biogen and the UK DRI. He has research funding unrelated to this work from Biogen and Bristol Meyers Squibb. ZC is founder and director of Oxford StemTech and Human-Centric DD. The remaining authors declare no competing interests.

Figures

Fig. 1
Fig. 1. Characterisation of cell-type specific transcriptomes and their relative enrichment in Alzheimer’s disease risk genes.
A UMAP plot of the integrated snRNAseq dataset from 57 brain samples. B UMAP plot after re-integration and clustering of the EC, FB, PC and SMC nuclei in (A) for discrimination between PC (cyan) and SMC (purple) nuclei (EC, coral and FB, green). C Heatmap of the average scaled expression of representative marker genes for each cluster. DF Dot plots of the overlap between cell markers for EC, FB, PC and SMC previously identified in human,, and (G) mouse snRNAseq studies and the cluster markers used in the present study. The size of the dots correspond to the overlap between the cluster gene sets and the colour of the dot to the adjusted p value of a one-sided overrepresentation Fisher’s exact test. H Dot plot of the average scaled per cluster expression of genes previously associated with genetic risk for AD (size, percentage of nuclei per cluster with >1 count; colour scale, average scaled gene expression). I MAGMA.Celltyping enrichment of brain nuclei in genomic loci associated with genetic risk for AD. The bars correspond to the log10p-value (one-sided) of the enrichment in GWAS signal i.e., the linear regression between cell type specificity of gene expression and the common variant genetic association with the disease using information from all genes (dark brown, line indicates significance threshold adjusted for all cell types). Enrichment of vascular nuclei is reduced after controlling for genes enriched in microglia (dark green). This analysis was performed on 153’128 nuclei from 36 independent samples (J) MAGMA.Celltyping AD risk gene enrichment of nuclei of the brain vasculature (dark brown bar, line indicates significance threshold adjusted for vascular cell types). Enrichment is not changed substantially after controlling for the enrichment of genetic loci associated with white matter hyperintensities (WMH) (light brown). This analysis was performed on 51’874 nuclei from 57 independent samples Abbreviations: AST astrocytes, EC endothelial cells, FB fibroblasts, MGL microglia, NEU neurons, NEU neurons, OLG oligodendrocytes, PC/SMC pericytes and smooth muscle cells, LYM lymphocytes. Source data are provided as a Source data file.
Fig. 2
Fig. 2. Alzheimer’s disease is associated with dysregulation of vascular homoeostasis in EC.
A Volcano plot showing genes differentially expressed in AD relative to NDC donor cortical tissue in EC. Representative significantly differentially expressed genes are identified. B Violin plots of representative genes differentially expressed in EC with AD relative to NDC. ANGPT2 (logFC=1.46, padj=0.04), HIF1A (logFC=0.68, padj=0.02), MEF2C (logFC=0.28, padj=0.09) and FGF2 (logFC=0.34, padj=0.05) are significantly upregulated, whereas RASAL2 (logFC = −0.76, padj=3.48×10⁻⁶), IFNGR1 (logFC=0.89, padj=0.03), ADAM10 (logFC = −0.30, padj=0.06) and PICALM (logFC = −0.27, padj=0.02) are downregulated. Statistical significance was determined using a likelihood ratio test with a mixed-effects model and a zero-inflated negative binomial distribution (two-sided). For demonstration purposes, the FGF2 violin plot describes expression only for nuclei in which FGF2 is expressed, although the statistical analysis was performed on all nuclei. C Dot plots of the functional enrichment analysis on the DEG that are up- and down-regulated in EC (dot size, functional enrichment gene set size; colour, FDR, one-sided overrepresentation Fisher’s exact test) with AD relative NDC. D IHC of sections from the somatosensory cortex of NDC (left) and AD (right) donors highlighting increased expression of ANG2 (coded by ANGPT2), FGF2, FGFR1 and decreased expression of ADAM10 in the vessel wall with AD. Arrowheads denote the protein binding in the vascular wall. Scale bar = 50 μm. The IHC experiment was performed on 24 independent samples. E Gene co-expression module hierarchy for EC. Modules that belong to the same branch are related, i.e., larger (“parent”) modules are closer to the centre of the plot and are further divided into subset (“children”) modules. “Children” modules are subsets of the “parent” ones and have higher numbers as names than their “parents”. Modules that show a significant overrepresentation of DEG (as shown in the volcano plots of Fig. 2A) by means of a (one-sided) Fisher’s exact test are labelled and represented as coloured points in the graph (red, for modules showing an overrepresentation of upregulated DEG; blue, showing an overrepresentation of downregulated DEG). Module number font size corresponds to the significance of the overrepresentation of DEG in the module. In the boxes, the top (maximum 5) hub genes (genes with the higher number of significant correlations within the module) are described. F Circular heatmap of odds ratios from the functional enrichment analyses for the EC modules that show a significant DEG overrepresentation (significant modules that show redundant functional enrichment terms were omitted from this heatmap). The adjusted p values of the significance of the overrepresentation are provided in Supplementerary file 5. The inner two tracks of the circular heatmap represent the significance (−log10(padj), one-sided) of the overrepresentation of down- (innermost track) and up-regulated DEG (second innermost track). The DGE and co-expression analyses were performed on 70’537 nuclei from 77 independent samples. Source data are provided as a Source data file.
Fig. 3
Fig. 3. Angiogenic and inflammatory pathways are differentially expressed in FB and PC co-expression network modules with AD.
Volcano and violin plots showing genes differentially expressed in AD relative to NDC donor cortical tissue in FB (A, B) and PC (C, D). In FB, PDE7A (logFC=1.33, padj=0.007), TRPM3 (logFC=1.44, padj=0.09), ROBO1 (logFC=1.35, padj=0.09) are significantly upregulated, whereas BCL2L1 (logFC = −0.35, padj=0.04), SPTBN1 (logFC = −1.34, padj=0.0001) and LAMC1 (logFC = −0.84, padj=0.01) are downregulated. In PC, TCF4 (logFC=1.27, padj=0.01), ARHGAP29 (logFC=1.47, padj=0.004), PLOD2 (logFC=0.91, padj=0.003) are significantly upregulated, whereas RASAL2 (logFC = −1.15, padj=0.005), EGFR (logFC = −0.76, padj=0.07) and CFLAR (logFC = −0.38, padj=0.03) are downregulated. Statistical significance was determined using a likelihood ratio test with a mixed-effects model and a zero-inflated negative binomial distribution (two-sided). For demonstration purposes, the TRPM3, EGFR, PLOD2, LAMC1 and BCL2L1 violin plots describe expression only for nuclei in which the respective genes are expressed, although the statistical analysis was performed on all nuclei. E Gene co-expression module hierarchy for FB and (F) PC. Modules that belong to the same branch are related, i.e., larger (“parent”) modules are closer to the centre of the plot and are further divided into subset (“children”) modules. “Children” modules are subsets of the “parent” ones and have higher numbers as names than their “parents”. Modules that show a significant overrepresentation of DEG (as shown in the volcano plots of Fig. 3A–C) by means of a one-sided Fisher’s exact test are labelled and represented as coloured points in the graph (red, for modules showing an overrepresentation of upregulated DEG; blue, showing an overrepresentation of downregulated DEG). Module number font size corresponds to the significance of the overrepresentation of DEG in the module. In the boxes, the top (maximum 5) hub genes (genes with the higher number of significant correlations within the module) are described. G Circular heatmap of odds ratios from the functional enrichment analyses for the FB and (H) PC modules that show a significant DEG overrepresentation (significant modules that show redundant functional enrichment terms were omitted from this heatmap). The adjusted p values of the significance of the overrepresentation are provided in Supplementary file 5. The inner two tracks of the circular heatmap represent the significance (−log10(padj), one-sided) of the overrepresentation of down- (innermost track) and up-regulated DEG (second innermost track). The DGE and co-expression analyses were performed on 9’594 PC and 20’885 FB nuclei from 57 independent samples. Source data are provided as a Source data file.
Fig. 4
Fig. 4. Differentially expressed genes (DEG) with AD relative to NDC found in two-layer neighbourhoods of AD risk genes.
A Dot plot of the overrepresentation of DEG identified in each cluster (abscissa) in the 2-layer neighbourhood of each GWAS gene (ordinate) (dot size, number of the overlapping genes; colour, adjusted p value of the one-sided Fisher’s exact test). Functional enrichment of prioritised GWAS genes in EC (B), FB (C) and PC (D)(colour scales represent the odds ratios of enrichment). Adjusted p values of the (one-sided) Fisher’s exact test are provided in the source data and in Supplementary file 7. Source data are provided as a Source data file.
Fig. 5
Fig. 5. Increased gene expression in EC with increased Aβ immunohistochemical staining density highlighted increased expression of genes associated with apoptosis.
A Volcano plot showing genes with a significant positive (red) of negative (blue) correlation with tissue Aβ staining density in EC. B Regression plots of individual genes associated with apoptosis, illustrating their association with Aβ levels: CFLAR (logFC = −0.32, padj=0.08), RGCC (logFC=0.42, padj=0.01), BTG1 (logFC=0.1, padj=0.09) and AKR1C3 (logFC=0.19, padj=0.03). For each gene, two plots are presented, the plot in the upper row show the scatter plot of the regression between the average expression value and the Aβ density in each sample, whereas the plot in the lower row shows the regression between the percentage of non-zero count nuclei in each sample and the Aβ density in each sample. The DGE analysis was performed using a likelihood ratio test with a mixed-effects model and a zero-inflated negative binomial distribution (two-sided). It takes into account both the distribution of the non-zero normalised counts (corresponding to the plot in the upper row) and the abundance of non-zero nuclei in the samples (corresponding to the lower row). Aβ in the horizontal axis is presented as scaled IHC binding values. The best-fit linear regression lines and 95% confidence intervals are shown. C Dot plots of the functional enrichment analysis on the DEG that are positively and negatively associated to Aβ (dot size, functional enrichment gene set size; colour, FDR, one-sided overrepresentation Fisher’s exact test). Source data are provided as a Source data file.
Fig. 6
Fig. 6. Regression analysis of gene expression in EC as a function of pTau tissue density suggests increased apoptosis.
A Volcano plot showing genes with a significant positive (red) of negative (blue) correlation with tissue pTau density in EC. B Regression plots of individual genes associated to apoptosis, CCN2 (logFC= 0.80, padj=0.003), ANGPT2 (logFC= 1.73, padj=0.07), RGCC (logFC=0.41, padj=0.03), BTG1 (logFC=0.11, padj=0.02). For each gene, two plots are presented, the plot in the upper row show the scatter plot of the regression between the average expression value and the pTau density in each sample, whereas the plot in the lower row shows the regression between the percentage of non-zero counts across the nuclei in each sample and the pTau density in each sample. The DGE analysis was performed using a likelihood ratio test with a mixed-effects model and a zero-inflated negative binomial distribution (two-sided). It takes into account both the distribution of the non-zero normalised counts (corresponding to the plot in the upper row) and the abundance of non-zero nuclei in the samples (corresponding to the lower row). pTau in the horizontal axis is presented as scaled IHC binding values. The best-fit linear regression lines and 95% confidence intervals are shown (C) Dot plots of the functional enrichment analysis on the DEG that are positively and negatively associated to pTau (dot size, functional enrichment gene set size; colour, FDR, one-sided overrepresentation Fisher’s exact test). Source data are provided as a Source data file.
Fig. 7
Fig. 7. Defective angiogenesis and blood brain barrier leakage is associated with cerebral hypoperfusion and Aβ pathology in AD.
A Scatterplot showing reduced MAG:PLP1 ratio (logFC = −0.72, unadjusted p = 0.012, two-sided t test) in the temporal cortex with AD (red dots) relative to NDC (blue dots). Horizontal bars represent the mean ± SEM. This experiment was performed on 10 independent samples (4 NDC and 6 AD). B Scatterplot showing increased insoluble Aβ42 in the temporal cortex with AD relative to NDC (logFC=2.67, unadjusted p = 0.009). This experiment was performed on 10 independent samples (4 NDC and 6 AD). Scatterplots showing the relationship between MAG:PLP1 and Aβ (Pearson’s r = −0.59, unadjusted p = 0.067, 10 samples, 4 NDC and 6 AD) (C), CD31 (endothelial marker) (Pearson’s r = −0.78, unadjusted p = 0.008, 10 samples, 4 NDC and 6 AD) (D), the ratio of CD105 (a marker of neoangiogenesis) adjusted to CD31 content (Pearson’s r = 0.78, unadjusted p = 0.011, 9 samples, 3 NDC and 6 AD) (E) and tissue fibrinogen concentration (Pearson’s r = −0.63, unadjusted p = 0.0049, 10 samples, 4 NDC and 6 AD) (F). The best-fit linear regression lines and 95% confidence intervals are shown. Each point represents the mean of duplicate measurements for an individual. *p < 0.05, **p < 0.01. Source data are provided as a Source data file.
Fig. 8
Fig. 8. NicheNet intercellular communication analysis identified potential regulators of EC DEG associated with proinflammatory and anti-angiogenic gene expression in astrocytes and perivascular macrophages.
A Circular heatmap and chord diagram of the results of the NicheNet analysis. The circular plot is divided (based on the innermost track) to separately represented ligand (black track) and target genes (grey track). A heatmap for the ligand genes on the 2nd to the 6th tracks (from inner- to outer-most) represents the average scaled expression of each ligand in each of the “sender” vascular cell types (each cell type -log10(padj) is represented on a different track). The two outermost tracks describe the differential expression (logFC) of the associated genes in the “received” EC. The outermost track represented the logFC and the 2nd outermost track represents the value. The links of the diagram represents the regulatory potential between the ligand and the target genes. B Astrocytic APOE (logFC=0.96, pval = .03), PVM VEGFA (logFC = −0.31, pval=0.08), TGFB1 (logFC = −0.28, pval=0.0007) and GPNMB (logFC=0.23, pval=0.04) potentially regulate the majority of EC DEG and are significantly differentially expressed with AD relative to NDC. Statistical significance was determined using a likelihood ratio test with a mixed-effects model and a zero-inflated negative binomial distribution. The analysis was performed on 170’299 astrocytic and 14’861 PVM nuclei from 57 independent samples. P values (unadjusted) refer to two-sided statistical tests. Source data are provided as a Source data file. C IHC in a sample form the entorhinal cortex of sections from NDC (left) and AD (right) donors binding of VEGFA in the vessel wall with AD. Arrowheads denote the VEGFA binding in the vascular wall. The IHC experiment was performed on 24 independent samples. Scale bar = 50 μm. Source data are provided as a Source data file.

Similar articles

Cited by

References

    1. Scheltens P, et al. Alzheimer’s disease. Lancet. 2016;388:505–517. doi: 10.1016/S0140-6736(15)01124-1. - DOI - PubMed
    1. Kunkle BW, et al. Genetic meta-analysis of diagnosed Alzheimer’s disease identifies new risk loci and implicates Abeta, tau, immunity and lipid processing. Nat. Genet. 2019;51:414–430. doi: 10.1038/s41588-019-0358-2. - DOI - PMC - PubMed
    1. Jansen IE, et al. Genome-wide meta-analysis identifies new loci and functional pathways influencing Alzheimer’s disease risk. Nat. Genet. 2019;51:404–413. doi: 10.1038/s41588-018-0311-9. - DOI - PMC - PubMed
    1. Andrews SJ, Fulton-Howard B, Goate A. Interpretation of risk loci from genome-wide association studies of Alzheimer’s disease. Lancet Neurol. 2020;19:326–335. doi: 10.1016/S1474-4422(19)30435-1. - DOI - PMC - PubMed
    1. Skene NG, et al. Genetic identification of brain cell types underlying schizophrenia. Nat. Genet. 2018;50:825–833. doi: 10.1038/s41588-018-0129-5. - DOI - PMC - PubMed

Substances