. 2024 Mar 12;15(1):1905.
doi: 10.1038/s41467-024-45912-w.

Numerosity estimation of virtual humans as a digital-robotic marker for hallucinations in Parkinson's disease

Affiliations

Numerosity estimation of virtual humans as a digital-robotic marker for hallucinations in Parkinson's disease

Louis Albert et al. Nat Commun. .

Abstract

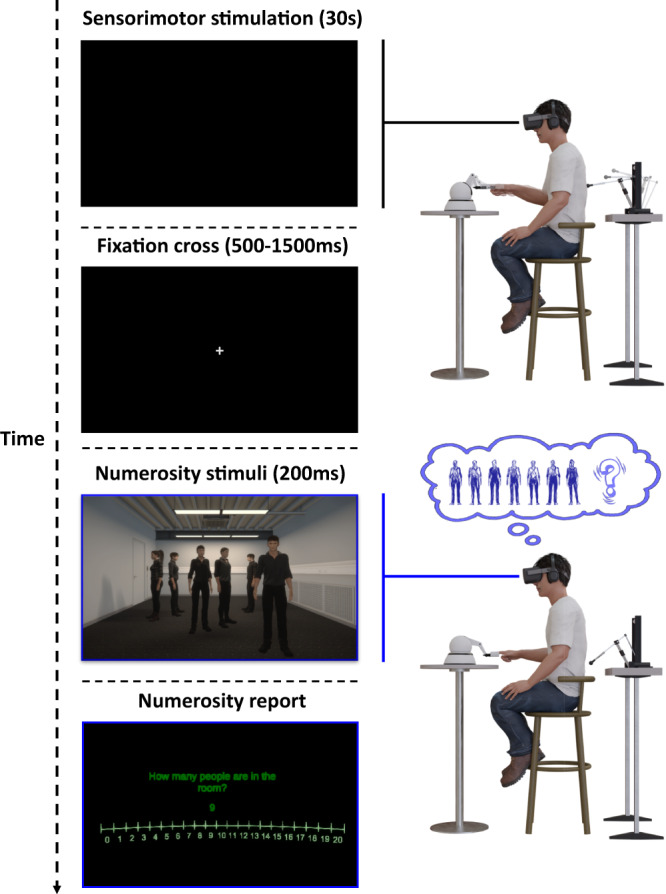
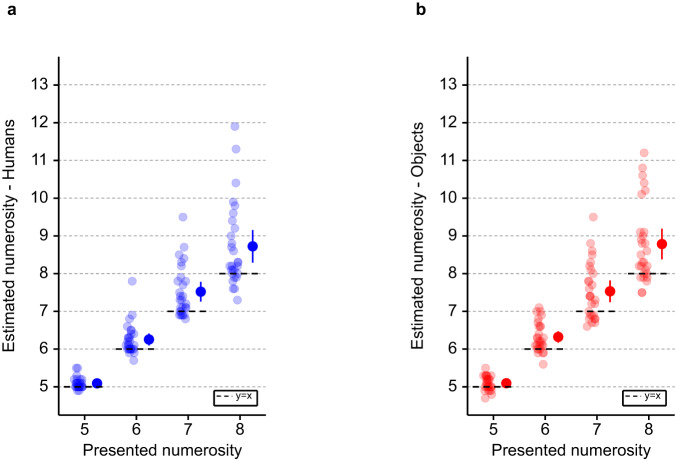
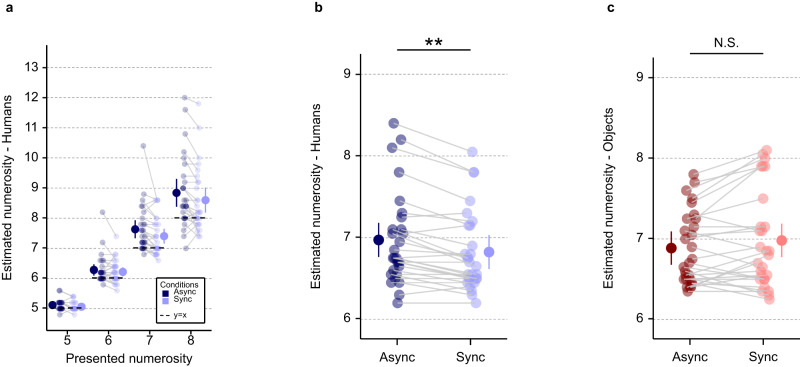
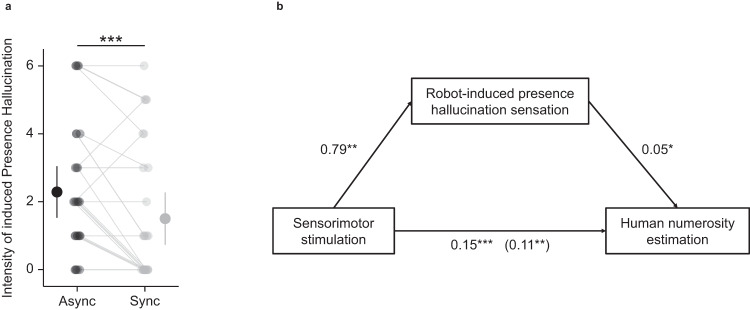
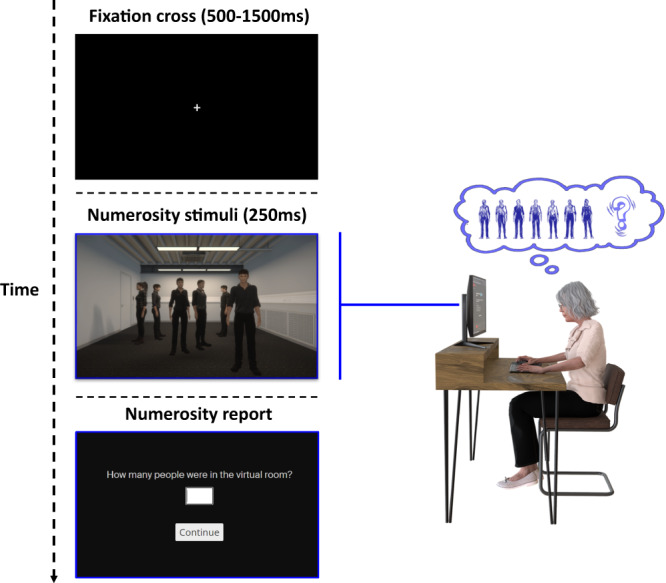
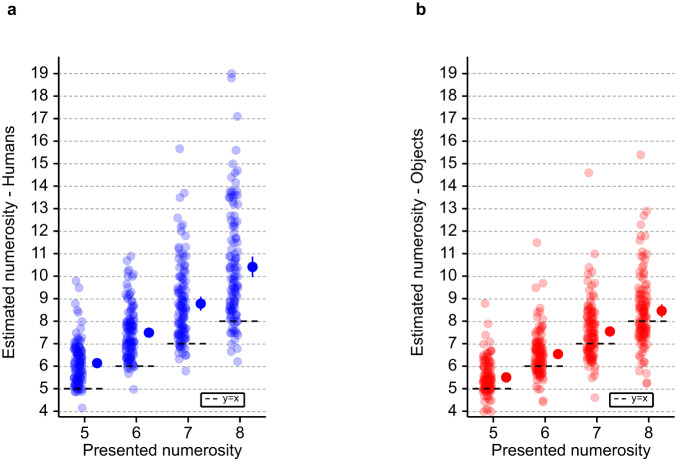
Hallucinations are frequent non-motor symptoms in Parkinson's disease (PD) associated with dementia and higher mortality. Despite their high clinical relevance, current assessments of hallucinations are based on verbal self-reports and interviews that are limited by important biases. Here, we used virtual reality (VR), robotics, and digital online technology to quantify presence hallucination (vivid sensations that another person is nearby when no one is actually present and can neither be seen nor heard) in laboratory and home-based settings. We establish that elevated numerosity estimation of virtual human agents in VR is a digital marker for experimentally induced presence hallucinations in healthy participants, as confirmed across several control conditions and analyses. We translated the digital marker (numerosity estimation) to an online procedure that 170 PD patients carried out remotely at their homes, revealing that PD patients with disease-related presence hallucinations (but not control PD patients) showed higher numerosity estimation. Numerosity estimation enables quantitative monitoring of hallucinations, is an easy-to-use unobtrusive online method, reaching people far away from medical centers, translating neuroscientific findings using robotics and VR, to patients' homes without specific equipment or trained staff.


Conflict of interest statement

A patent application has been submitted (application number EP23154061.8 – Numerosity estimation impairment measurement system), describing a solution for measuring and quantifying an impairment in numerosity estimation in human subjects, based on the methods described in this manuscript, with Ecole Polytechnique Fédérale de Lausanne (EPFL) as patent applicant, and L.A., O.B., F.B., B.H., and J.P. as inventors. O.B. is inventor on patent US 10,286,555 B2 held by the Swiss Federal Institute (EPFL) that covers the robot-controlled induction of presence hallucination. O.B. is inventor on patent US 10,349,899 B2 held by the Swiss Federal Institute (EPFL) that covers a robotic system for the prediction of hallucinations for diagnostic and therapeutic purposes. O.B. is co-founder and shareholder of Metaphysiks Engineering SA, a company that develops immersive technologies, including applications of the robotic induction of presence hallucinations that are not related to the diagnosis, prognosis or treatment of Parkinson’s disease. O.B. is a member of the board and shareholder of Mindmaze SA. The authors declare no other competing interests.

Figures

Fig. 1
Fig. 1. Integrating sensorimotor robotic stimulation, virtual reality, and numerosity estimation task (study 1).
In each human numerosity estimation task trial, participants first manipulated the robotic system for 30 seconds (either in the asynchronous (500 ms delay; presence hallucination inducing condition) or the synchronous condition (0 ms delay)). This was followed by the appearance of a fixation cross (500–1500 ms), indicating to participants that they could stop moving the robotic system. Then, a scene containing a different number of people (range 5–8) was shown for 200 ms and participants had to estimate the number of people they saw. All visual stimuli were shown in immersive virtual reality on a head-mounted display (see methods for further detail). Please note that the numerosity stimuli were displayed in very dim lightning inside virtual reality (3D scenes), which is increased on the displayed material (2D picture) for presentation purpose.
Fig. 2
Fig. 2. Numerosity estimation (study 1).
General numerosity estimation performance for each tested numerosity in (a) the human numerosity estimation task and (b) the object numerosity estimation task (study 1). Each dot indicates the individual numerosity estimation task mean estimate for the corresponding presented numerosity. The dots with the bar on the right sides indicate the in-between subject mean for each presented numerosity. Note the general overestimation bias in the human numerosity estimation task and the object numerosity estimation task. Error bar represents 95% confidence interval. n = 28 healthy participants. Source data are provided as a Source Data file.
Fig. 3
Fig. 3. Human and object numerosity estimation tasks as a function of sensorimotor stimulation (synchronous, asynchronous) (study 1).
a Task performance is shown for each presented numerosity in the human numerosity estimation task, for the asynchronous (dark blue) and synchronous (light blue) sensorimotor stimulation. Each linked pair of dots indicates the individual human numerosity estimation task mean estimate for the corresponding numerosity in asynchronous (dark blue) and synchronous (light blue) sensorimotor stimulation. The dots with the bar on the left and right sides indicate the mixed-effects linear regression between asynchronous (dark blue) and synchronous (light blue) sensorimotor stimulation for each tested numerosity. b Human numerosity estimation task (asynchronous (dark blue) versus synchronous (light blue) sensorimotor stimulation). Sensorimotor stimulation significantly modulates human numerosity estimation (t(2197) = −2.9; p = 0.003; effect size = −0.18 (95% confidence interval = [−0.29; −0.06])). Each linked pair of dots indicates the individual human numerosity estimation task mean estimate in asynchronous (dark blue) and synchronous (light blue) sensorimotor stimulation. The dots with the bar on the left and right sides indicate the mixed-effects linear regression between asynchronous (dark blue) and synchronous (light blue) sensorimotor stimulation. c Object numerosity estimation (asynchronous (dark red) versus synchronous (light red) sensorimotor stimulation). Sensorimotor stimulation does not significantly modulates object numerosity estimation (t(2197) = 1.87; p = 0.06; effect size = 0.11 (95% confidence interval = [−0.01; 0.23])). Each linked pair of dots indicates the individual object numerosity estimation task mean estimate in asynchronous (dark red) and synchronous (light red) sensorimotor stimulation. The dots with the bar on the left and right sides indicate the mixed-effects linear regression between asynchronous (dark red) and synchronous (light red) sensorimotor stimulation. Error bar represents 95% confidence interval. **P ≤ 0.01. N.S., not significant. n = 28 healthy participants. Source data are provided as a Source Data file.
Fig. 4
Fig. 4. Robot-induced presence hallucination and its link to human numerosity estimation (study 1).
a Robot-induced presence hallucinations assessment ratings (asynchronous versus synchronous sensorimotor stimulation). Participants reported higher presence hallucinations ratings in the asynchronous sensorimotor condition (mean = 2.29, SD = 1.96) compared to the synchronous sensorimotor condition (mean = 1.50, SD = 1.99) (χ² (1, N = 28) = 12.00, p = 0.0005; effect size = −0.61 (95% confidence interval = [−1.01; −0.20])). Each linked pair of dots indicates the individual mean rating of robot-induced presence hallucination (asynchronous (dark grey) and synchronous (light grey) sensorimotor stimulation). The dots with the bar on the left and right sides indicate the mixed-effects linear regression between asynchronous (dark grey) and synchronous (light gray) sensorimotor stimulation. Error bar represents 95% confidence interval. b Results of causal mediation analysis. The effect of robotic sensorimotor stimulation (synchronous or asynchronous) on human numerosity estimation was partially mediated via robot-induced presence hallucination question rating. The regression coefficient between robotic sensorimotor stimulation (synchronous or asynchronous) and human numerosity estimation was significant ((F(1,27) = 26.05; p = 2.3e−5)). The regression coefficient between robot-induced presence hallucination question rating and human numerosity estimation was significant (F(1,27) = 10.44; p = 0.003). The indirect effect of robotic sensorimotor stimulation (synchronous or asynchronous) on human numerosity estimation via robot-induced presence hallucination question rating was 0.04. The significance of the indirect effect was tested using bootstrapping procedures (1000 samples), and the 95% confidence interval was computed by determining the indirect effects at the 2.5th and 97.5th percentiles. The indirect effect was significant (p = 0.01; 95% confidence interval = [0.006; 0.08]). *P ≤ 0.05; **P ≤ 0.01; ***P ≤ 0.001. n = 28 healthy participants. Source data are provided as a Source Data file.
Fig. 5
Fig. 5. Online human numerosity estimation task (study 2).
A single online human numerosity estimation task trial is shown. That started with the appearance of a fixation cross (500–1500 ms). After that, a scene containing different number of people (range 5–8) was shown for 250 ms and PD patients were asked to estimate the number of people that they saw. PD patients performed this web-based digital task at home, on their personal computer or tablet. PD Parkinson’s Disease.
Fig. 6
Fig. 6. Numerosity estimation (study 2).
General numerosity estimation performance for each tested numerosity in the a human numerosity estimation task and b object numerosity estimation task (study 2). Each dot indicates the individual human numerosity estimation task mean estimate at the corresponding tested numerosity. The dots with the bar on the right sides indicate the in-between subject mean at each presented numerosity. Note the general overestimation bias in human numerosity estimation task and object numerosity estimation task. The error bar represents 95% confidence interval. n = 118 patients with PD. Source data are provided as a Source Data file. PD Parkinson’s Disease.
Fig. 7
Fig. 7. Human and object numerosity estimation tasks for both PD patient groups (PD-PH and PD-nH) (study 2).
a Performance is shown in PD patients for each tested numerosity in the human numerosity estimation task for PD-PH (dark blue) and PD-nH (light blue) separately. Each dot indicates the individual human numerosity estimation task mean estimate for the tested numerosity (PD-PH (dark blue) and PD-nH (light blue)). The dots with the bar on the left and right sides indicate the mixed-effects linear regression between PD-PH (dark blue) and PD-nH (light blue) at each presented numerosity. b Human numerosity estimation task in PD patients (PD-PH vs PD-nH). The occurrence of presence hallucinations significantly modulates online human numerosity estimation task (t(122) = −3.16; p = 0.002; effect size = −0.41 (95% confidence interval = [−0.67; −0.15])). Each dot indicates the individual human numerosity estimation task mean estimate (PD-PH (dark blue) and PD-nH (light blue)). The dots with the bar on the left and right sides indicate the mixed-effects linear regression between PD-PH (dark blue) and PD-nH (light blue). c Object numerosity estimation task in PD patients (PD-PH vs PD-nH). No statistical difference in online object numerosity estimation task was observed between PD groups (PD-PH vs PD-nH) (t(122) = −0.59; p = 0.42; effect size = −0.10 (95% confidence interval = [−0.36; 0.15]))). Each dot indicates the individual object numerosity estimation task mean estimate (PD-PH (dark red) and PD-nH (light red)). The dots with the bar on the left and right sides indicate the mixed-effects linear regression between PD-PH (dark red) and PD-nH (light red). Error bar represents 95% confidence interval. **P ≤ 0.01. n = 118 patients with PD (63 PD-PH & 55 PD-nH). Source data are provided as a Source Data file. PD Parkinson’s Disease; PD-PH Parkinson’s Disease patients with Presence Hallucination, PD-nH Parkinson’s Disease patients with no Hallucination.

Similar articles

Cited by

References

    1. Kalia LV, Lang AE. Parkinson’s disease. Lancet. 2015;386:896–912. doi: 10.1016/S0140-6736(14)61393-3. - DOI - PubMed
    1. Postuma RB, Berg D. Advances in markers of prodromal Parkinson disease. Nat. Rev. Neurol. 2016;12:622–634. doi: 10.1038/nrneurol.2016.152. - DOI - PubMed
    1. ffytche, D. H. & Aarsland, D. Chapter Nineteen - Psychosis in Parkinson’s Disease. in International Review of Neurobiology (eds. Chaudhuri, K. R. & Titova, N.) 133 585–622 (Academic Press, 2017). - PubMed
    1. Diederich NJ, Fénelon G, Stebbins G, Goetz CG. Hallucinations in Parkinson disease. Nat. Rev. Neurol. 2009;5:331–342. doi: 10.1038/nrneurol.2009.62. - DOI - PubMed
    1. Fénelon G, Mahieux F, Huon R, Ziégler M. Hallucinations in Parkinson’s disease: Prevalence, phenomenology and risk factors. Brain. 2000;123:733–745. doi: 10.1093/brain/123.4.733. - DOI - PubMed