. 2024 Mar 12;10(1):132.
doi: 10.1038/s41420-024-01903-w.

Hypoxia and low-glucose environments co-induced HGDILnc1 promote glycolysis and angiogenesis

Affiliations

Hypoxia and low-glucose environments co-induced HGDILnc1 promote glycolysis and angiogenesis

Qing-Wei Zhang et al. Cell Death Discov. .

Abstract

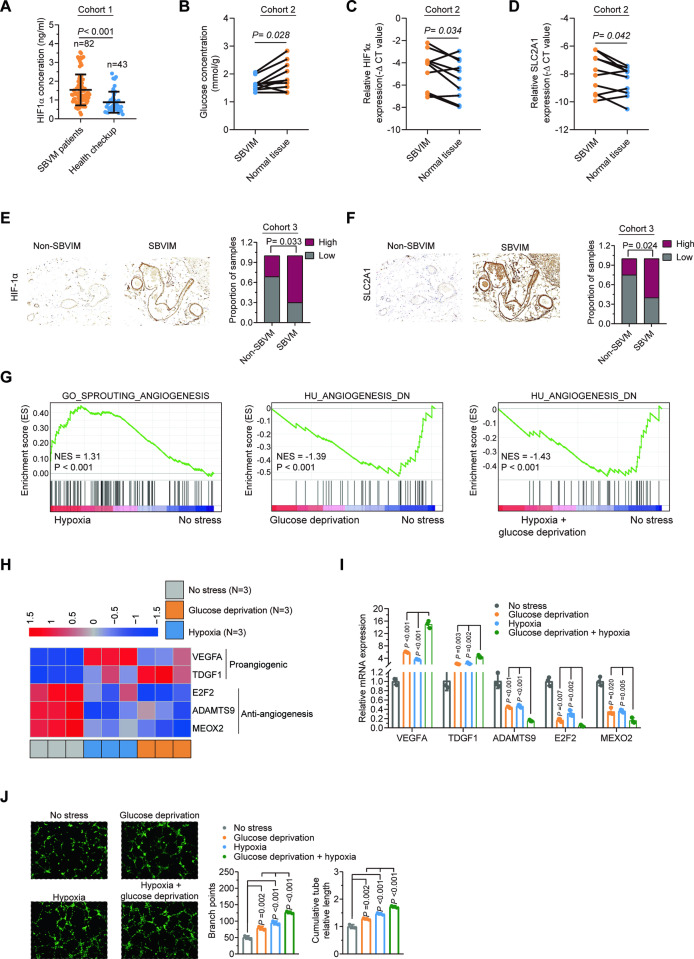
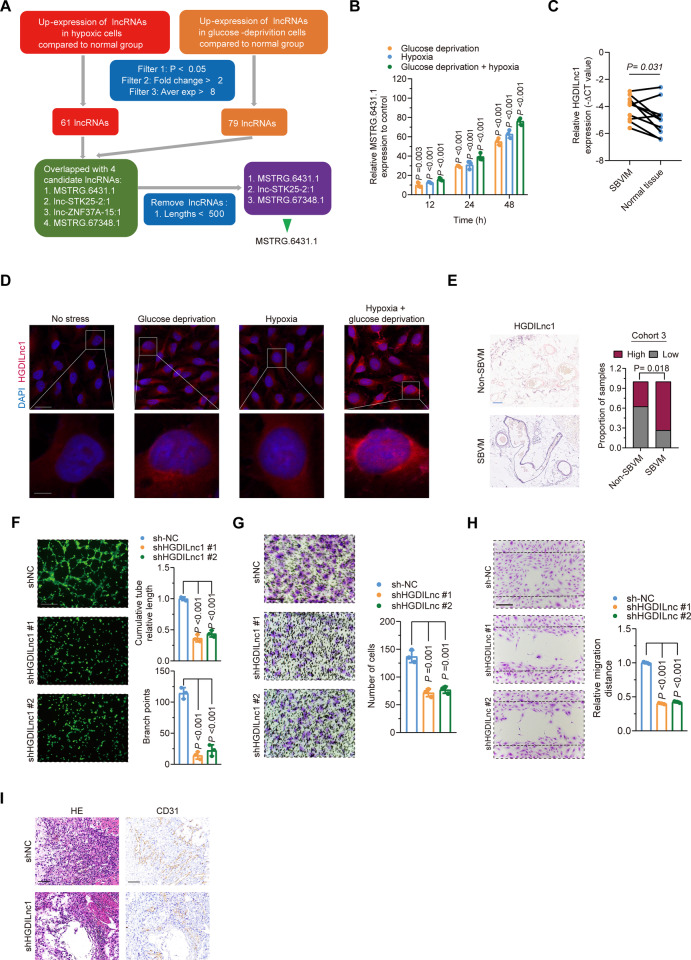
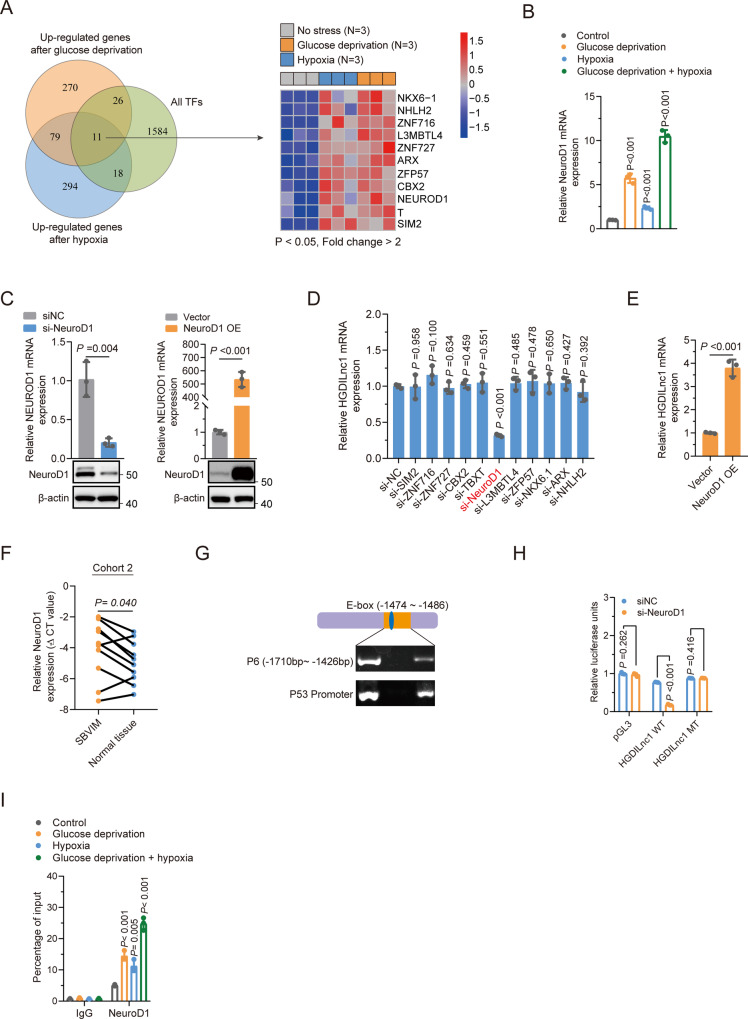
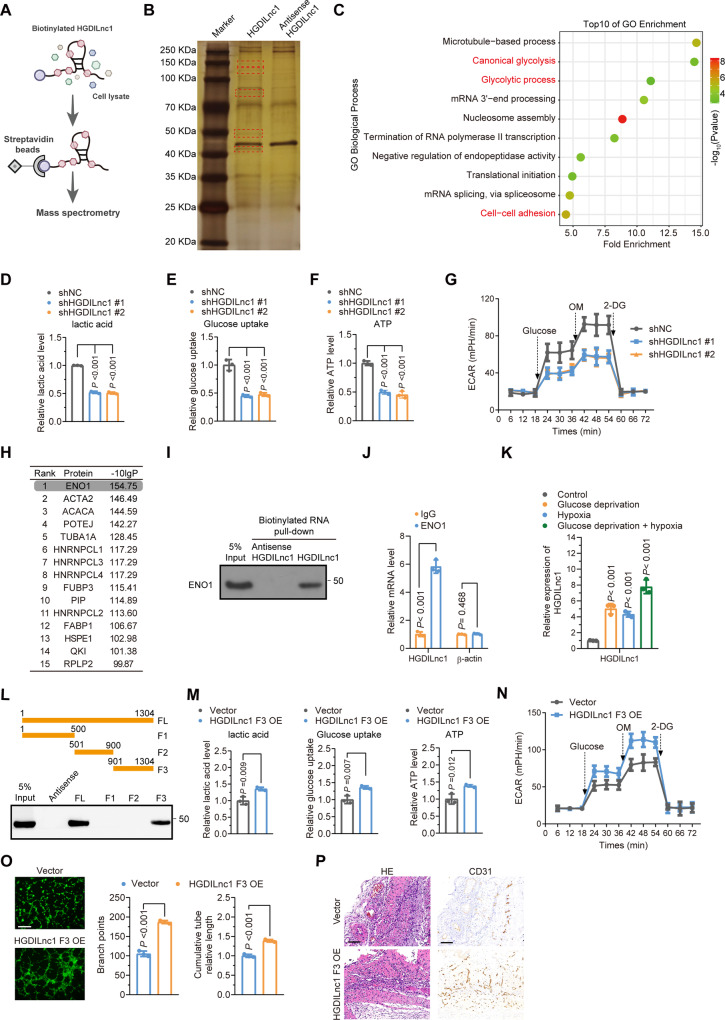
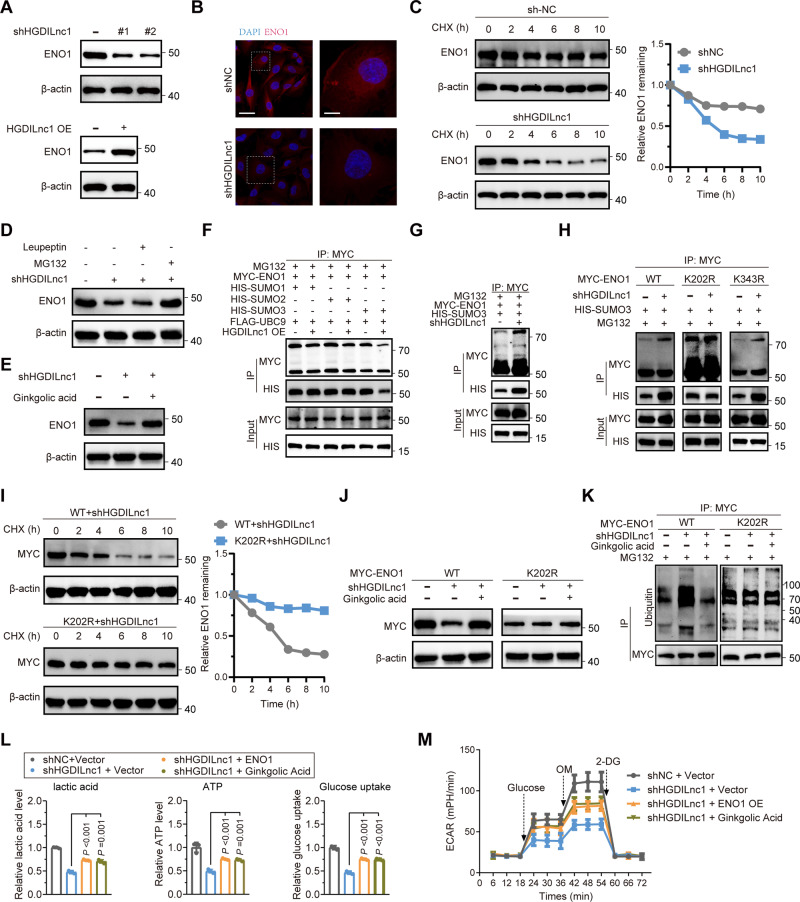
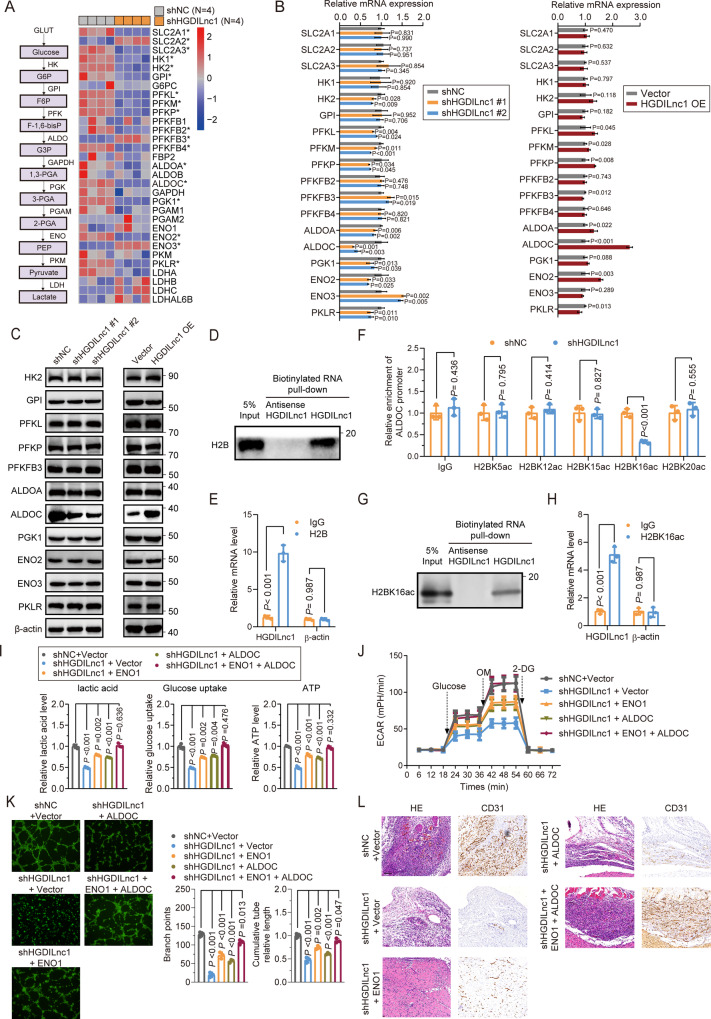
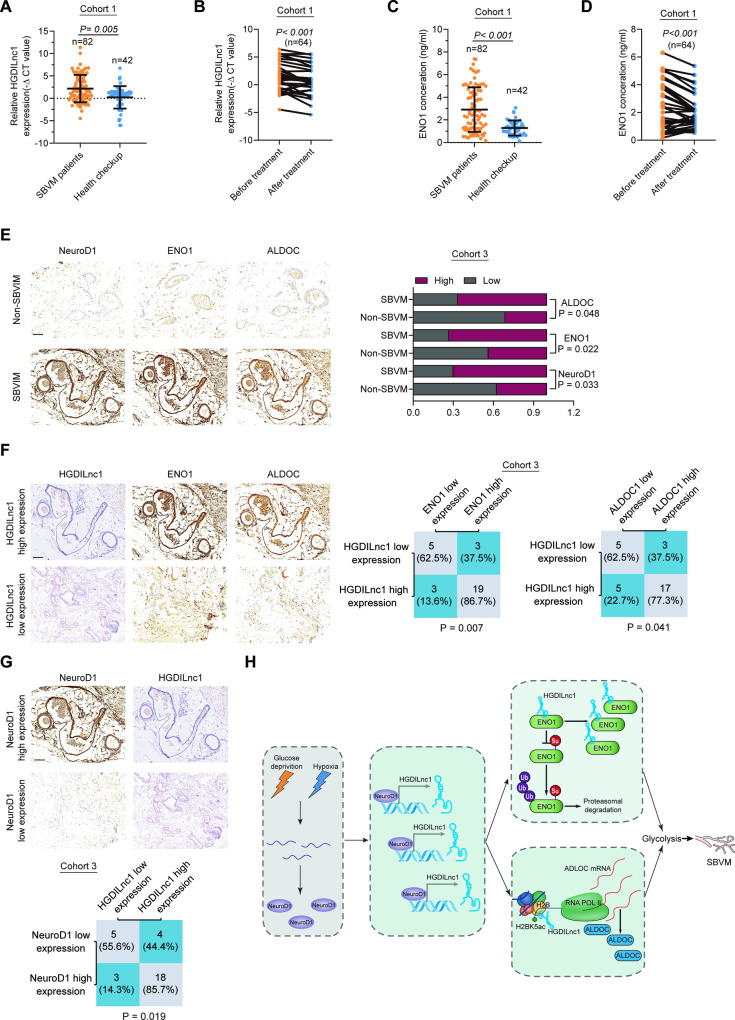
Small bowel vascular malformation disease (SBVM) commonly causes obscure gastrointestinal bleeding (OGIB). However, the pathogenetic mechanism and the role of lncRNAs in SBVM remain largely unknown. Here, we found that hypoxia and low-glucose environments co-augment angiogenesis and existed in SBVM. Mechanistically, hypoxia and low-glucose environments supported angiogenesis via activation of hypoxia and glucose deprivation-induced lncRNA (HGDILnc1) transcription by increasing binding of the NeuroD1 transcription factor to the HGDILnc1 promoter. Raised HGDILnc1 acted as a suppressor of α-Enolase 1 (ENO1) small ubiquitin-like modifier modification (SUMOylation)-triggered ubiquitination, and an activator of transcription of Aldolase C (ALDOC) via upregulation of Histone H2B lysine 16 acetylation (H2BK16ac) level in the promoter of ALDOC, and consequently promoting glycolysis and angiogenesis. Moreover, HGDILnc1 was clinically positively correlated with Neurogenic differentiation 1 (NeuroD1), ENO1, and ALDOC in SBVM tissues, and could function as a biomarker for SBVM diagnosis and therapy. These findings suggest that hypoxia and low-glucose environments were present in SBVM tissues, and co-augmented angiogenesis. Hypoxia and low-glucose environments co-induced HGDILnc1, which is higher expressed in SBVM tissue compared with normal tissue, could promoted glycolysis and angiogenesis.


Conflict of interest statement

The authors declare no competing interests.

Figures

Fig. 1
Fig. 1. Hypoxia and low-glucose environment co-induced SBVM.
A HIF-1α expression in the serum of non-SBVM (n = 42) and SBVM patients (n = 82) in cohort 1. B Glucose concentration in SBVM tissues and paired adjacent normal tissues (n = 10) measured by colorimetric analysis in cohort 2. C HIF-1α expression levels in SBVM and paired adjacent normal tissues (n = 10) measured by using qRT–PCR in cohort 2. D SLC2A1 expression levels in SBVM tissues and paired adjacent normal tissues (n = 10) measured by using qRT–PCR in cohort 2. E Representative immunohistochemical images (left) of HIF-1α in SBVM and non-SBVM tissues using IHC and proportions of high and low staining (right) in cohort 3. Scale bars: 100 μm. F IHC images (left) of SLC2A1 and analysis of staining levels in SBVM tissues and non-SBVM tissues (right) in cohort 3. Scale bars: 100 μm. G GSEA identified angiogenesis-related genes between HUVECs with hypoxia and HUVEC with controls. H Heatmap showing angiogenesis-related genes in cells with glucose deprivation, hypoxia, and controls for RNA microarray. I mRNA expression of angiogenesis-related genes in HUVEC cells measured by qRT–PCR after glucose deprivation, hypoxia, or glucose deprivation with hypoxia treatment. J Capillary tube formation for evaluation of angiogenesis in HUVECs after glucose deprivation, hypoxia, or glucose deprivation with hypoxia treatment. Scale bars: 100 μm.
Fig. 2
Fig. 2. Glucose deprivation and hypoxia co-induced HGDILnc1 to promote angiogenesis.
A Flowchart for selection of candidate lncRNAs from upregulated lncRNAs in glucose-deprived and hypoxic HUVEC cells. B MSTRG.6431.1 levels in HUVEC cell line measured by qRT–PCR after glucose deprivation, hypoxia, or glucose deprivation with hypoxia treatment for 12, 24, and 48 h. C HGDILnc1 levels in SBVM and paired adjacent tissues measured by qRT–PCR. D FISH of HGDILnc1 (red) in HUVEC cells after glucose deprivation, hypoxia, or glucose deprivation with hypoxia. Nuclei are seen in blue (DAPI). Scale bars, up: 20 μm; down: 5 μm. E Representative ISH images (left) of HGDIlnc1 in SBVM and non-SBVM tissues, and analysis (right) of high and low staining in SBVM and non-SBVM tissues in cohort 3. Scale bars: 100 μm. F Capillary tube formation for determining angiogenesis in HGDILnc1-silenced HUVECs. Scale bars: 100 μm. G Transwell assays for evaluating migration in HGDILnc1-silenced HUVECs. Scale bars: 100 μm. H Wound-healing assay for evaluating migration in HGDILnc1-silenced HUVECs of HGDILnc1. Scale bars: 100 μm. I H&E-stained 10 µm paraffin sections and CD31-labeled sections of the Matrigel plugs after HGDILnc1 silencing in an in vivo Matrigel implantation model. Scale bars: 100 μm.
Fig. 3
Fig. 3. Glucose deprivation and hypoxia co-induced upregulation of HGDILnc1 via transcription factor NeuroD1.
A Left: schematic diagram of screening procedure for differential expression (Fold change >2, P < 0.05) after hypoxia and glucose deprivation. Right: Heatmap of of transcription factors differentially upregulated between experimental and control groups. B NeuroD1 mRNA expression levels in HUVEC cells measured by using qRT–PCR after glucose deprivation, hypoxia, or glucose deprivation with hypoxia treatment. C NeuroD1 mRNA and protein expression levels in HUVEC cells by qRT–PCR and Western blot, respectively, after NeuroD1 silencing or NeuroD1 overexpression. D HGDILnc1 expression levels in HUVEC cells by qRT–PCR after silencing of candidate transcription factors. E HGDILnc1 expression levels in HUVEC cells measured by qRT–PCR after overexpression of NeuroD1. F NeuroD1 expression levels in SBVM and paired adjacent tissues measured by using qRT–PCR in cohort 2. G PCR amplification of NeuroD1-binding fragments of post-ChIP HGDILnc1 promoter fragments with anti-NeuroD1 antibody in cell HUVEC cell lysates. Fragments of P53 promoter serves as a positive control for NeuroD1-binging fragments. H Luciferase activity in NeuroD1-silenced HUVEC cells after transfection with HGDILnc1 wild-type (WT) or deletion mutants (MT) promoter luciferase reporter vectors. I Binding capacity of NeuroD1 to the indicated post-ChIP HGDILnc1 promoter fragments with anti-NeuroD1 antibody in in HUVEC cell lysates after glucose deprivation, hypoxia, or glucose deprivation with hypoxia treatment by ChIP-qPCR. The negative control was an anti-IgG antibody.
Fig. 4
Fig. 4. HGDILnc1 promoted glycolysis via ENO1.
A Pull-down assay experimental design. Biotinylated HGDILnc1 and antisense-HGDILnc1 RNA were incubated with HUVEC cell lysates. B Silver staining of HGDILnc1-associated proteins. Five HGDILnc1-associated bands (rectangular box) were excised and analyzed by mass spectrometry. C GO enrichment of HGDILnc1-associated proteins after RNA pull-down. DF Lactate production (D), glucose uptake (E), and ATP production (F) in HGDILnc1-silenced HUVEC cells by colorimetric analysis. G Extracellular acid ratio (ECAR) in HGDILnc1-silenced HUVEC cells. OM oligomycin, 2-DG 2-deoxyglucose. H Top 15 HGDILnc1-associated cellular proteins according to the −10lgP among the HGDILnc1-RNA pull-down proteins. I Western blot of ENO1 from antisense HGDILnc1 and HGDILnc1 pull-down assays. J RNA immunoprecipitation with anti-ENO1 antibody and specific primers were used to detect HGDILnc1. β-actin was used as a negative control. K Binding capacity of ENO1 to HGDILnc1 following RNA immunoprecipitation using an antibody against ENO1 in HUVEC cell lysates after measurement of glucose deprivation, hypoxia, or glucose deprivation with hypoxia treatment by qRT-PCR. L Western blot of ENO1 in samples pulled down by full-length (FL) or truncated HGDILnc1 (F1: 1–500, F2: 501–900, F3: 901–1304). M Lactate production (left), glucose uptake (middle), and ATP production (right) were measured in HUVEC cells overexpressing the truncated HGDILnc1 F3 fragment by colorimetric analysis. N Extracellular acid ratio (ECAR) in cells after overexpression of the truncated HGDILnc1 F3 fragment in HUVEC cells. OM oligomycin, 2-DG 2-deoxyglucose. O Capillary tube formation for evaluating angiogenesis in HUVECs after overexpression of the truncated HGDILnc1 F3 fragment. P H&E-stained 10 µm paraffin sections (left) and CD31-labeled paraffin sections (right) of the Matrigel plugs after overexpression of truncated HGDILnc1 F3 fragment in an in vivo Matrigel implantation model.
Fig. 5
Fig. 5. HGDILnc1 regulates the stability of ENO1 through suppression of ENO1 SUMOylation-triggered ubiquitination.
A Western blots of ENO1 after ENO1 silencing (up) and overexpression of HGDILnc1 (down). B Representative image of immunofluorescence staining of ENO1 expression in HGDILnc1-silenced HUVEC cells. Scale bars, left: 20 μm; right: 5 μm. C Western blot was used for measuring the half-life of ENO1 after treatment with 20 μM cycloheximide (CHX) in HGDILnc1-silenced HUVECs. D Western blot of ENO1 in HGDILnc1-silenced HUVEC cells after treatment of 10 μM Leupeptin or 20 μM MG132. E Western blot of ENO1 in HGDILnc1-silenced HUVEC cells with and without treatment with 20 μM ginkgolic acid. F Co-immunoprecipitation (co-IP) analysis for detection of SUMOylation in HGDILnc1-overexpressing cells after transfection with MYC-ENO1 and FLAG-UBC9 and HIS-SUMOs using the specified antibodies. G Co-IP analysis for detection of SUMOylation in HGDILnc1-silenced HUVEC cells with co-transfection of MYC-ENO1 and HIS-SUMO3 using the specified antibodies. H Co-IP analysis for the detection of SUMOylation in HGDILnc1-silenced HUVEC cells with co-transfection of HIS-SUMO3 and MYC-ENO1 WT, K202R, and K343R using the specified antibodies. I Western blot was used for measurement of the half-life of MYC-ENO1 WT and K202R after treatment with 20 μM CHX in HGDILnc1-silenced HUVEC cells. J Western blot of the MYC-ENO1 WT and K202R in HGDILnc1-silenced HUVEC cells with or without treatment with the 20 μM ginkgolic acid. K Co-IP analysis for the detection of ubiquitination in HGDILnc1-silenced HUVEC cells with transfection of MYC-ENO1 WT or K202R with or without treatment with20 μM ginkgolic acid using the specified antibodies. L Lactate production (left), glucose uptake (middle) and ATP production (right) were measured in HGDILnc1-silenced HUVEC cells with ENO1 transfection or treatment with 20 μM ginkgolic acid. M ECAR in HGDILnc1-silenced HUVEC cells with transfection of ENO1 or treatment of 20 μM ginkgolic acid.
Fig. 6
Fig. 6. HGDILnc1 regulates the transcription of ALDOC through upregulation of H2BK16ac levels in the ALDOC promoter.
A Left: schematic illustration for aerobic glycolysis-related enzyme genes. Right: Heatmap showing differentially expressed glycolysis-related enzyme genes between HGDILnc1-silenced cells and controls, by RNA-sequencing. Asterisk (*) indicates a significant difference in expression of the indicated gene between HGDILnc1-silenced cells and controls. B mRNA expression levels of potential differentially expressed aerobic glycolysis-related genes evaluated by qRT–PCR in HGDILnc1-silenced HUVECs (left) or HGDILnc1-overexpressing cells (right). C Western blot of potential differentially expressed aerobic glycolysis-related proteins in HGDILnc1-silenced HUVEC cells (left) or HGDILnc1-overexpressing cells (right). D Western blot of histone H2B from antisense HGDILnc1 and HGDILnc1 pull-down assays. E RNA immunoprecipitation experiments were performed using an anti-H2B antibody, and specific primers were used to detect HGDILnc1. β-actin was used as a negative control. F Binding capacity of candidate H2B acetylation to the ALDOC promoter measured by ChIP-qPCR after knocking down HGDILnc1. An IgG antibody was used as a negative control. G Western blot of histone H2BK16ac from antisense HGDILnc1 and HGDILnc1 pull-down assays. H RNA immunoprecipitation experiments were performed using an anti-H2BK16ac antibody, and specific primers were used to detect HGDILnc1. β-actin was used as a negative control. I Lactate production (left), glucose uptake (middle) and ATP production (right) were measured in HGDILnc1-silenced HUVEC cells with transfection of ENO1 or ALDOC or co-transfection of ENO1 and ALDOC, shown by colorimetric analysis. J Extracellular acid ratio (ECAR) in HGDILnc1-silenced HUVEC cells with transfection of ENO1 or ALDOC or co-transfection of ENO1 and ALDOC. OM oligomycin, 2-DG 2-deoxyglucose. K Capillary tube formation for evaluating angiogenesis in HGDILnc1-silenced HUVEC cells with transfection of ENO1 or ALDOC or co-transfection of ENO1 and ALDOC. L Representative images of H&E-stained 10 µm paraffin sections (left) and CD31-labeled paraffin sections (right) of the Matrigel plugs after HGDILnc1 silencing with overexpression of ENO1 or ALDOC or co-overexpression of ENO1 and ALDOC in an in vivo Matrigel implantation model.
Fig. 7
Fig. 7. Clinical significance of the NeuroD1/HGDILnc1/ENO1/ALDOC axis in SBVM patients.
A HGDILnc1 expression in the sera of healthy individuals (n = 42) and SBVM patients (n = 82) in cohort 1. B HGDILnc1 expression in the sera of SBVM patients before and after thalidomide treatment (n = 32) in cohort 1. C ENO1 expression in the sera of healthy individuals (n = 42) and SBVM patients (n = 82) in cohort 1. D ENO1 expression in the sera of SBVM patients before and after thalidomide treatment (n = 32) in cohort 1. E Representative immunohistochemical images (left) of NeuroD1, ENO1, and ALDOC in SBVM tissues and non-SBVM tissues using IHC analysis and statistical analysis of the proportions of high and low staining in SBVM tissues and non-SBVM tissues (right). Scale bars: 100 μm. F Representative in situ hybridization images of HGDILnc1 and immunohistochemical images of ENO1 and ALDOC expression in SBVM with high expression and low HGDILnc1 expression (left), and statistical analysis of SBVM tissues under different staining conditions (right) in cohort 3. Scale bars: 100 μm. G Representative immunohistochemical images of NeuroD1 expression and in situ hybridization images of HGDILnc1 expression in SBVM with high and low NeuroD1 expression (up), and statistical analysis of SBVM tissues under different staining conditions (down) in cohort 3. Scale bars: 100 μm. H Schematic diagram of the relationship among glucose deprivation, hypoxia, NeuroD1, HGDILnc1, ENO1, ALDOC, glycolysis metabolism, and SBVM. Note: the representative immunohistochemical images of ENO1, ALDOC in SBVM tissue in (E) were same to the representative immunohistochemical images of ENO1, ALDOC in SBVM with high expression of HGDILnc1 in (F) for illustration of different proteins expression in the same SBVM patients.

Similar articles

Cited by

References

    1. Jackson CS, Strong R. Gastrointestinal angiodysplasia: diagnosis and management. Gastrointest Endosc Clin N Am. 2017;27:51–62. doi: 10.1016/j.giec.2016.08.012. - DOI - PubMed
    1. Junquera F, Saperas E, de Torres I, Vidal MT, Malagelada JR. Increased expression of angiogenic factors in human colonic angiodysplasia. Am J Gastroenterol. 1999;94:1070–6. doi: 10.1111/j.1572-0241.1999.01017.x. - DOI - PubMed
    1. Tang CT, Zhang QW, Wu S, Tang MY, Liang Q, Lin XL, et al. Thalidomide targets EGFL6 to inhibit EGFL6/PAX6 axis-driven angiogenesis in small bowel vascular malformation. Cell Mol Life Sci. 2020;77:5207–21. doi: 10.1007/s00018-020-03465-3. - DOI - PMC - PubMed
    1. Feng N, Chen H, Fu S, Bian Z, Lin X, Yang L, et al. HIF-1alpha and HIF-2alpha induced angiogenesis in gastrointestinal vascular malformation and reversed by thalidomide. Sci Rep. 2016;6:27280. doi: 10.1038/srep27280. - DOI - PMC - PubMed
    1. Holleran G, Hall B, O’Regan M, Smith S, McNamara D. Expression of angiogenic factors in patients with sporadic small bowel angiodysplasia. J Clin Gastroenterol. 2015;49:831–6. doi: 10.1097/MCG.0000000000000260. - DOI - PubMed