. 2024 Mar 12;15(1):2221.
doi: 10.1038/s41467-024-46629-6.

Identification of four biotypes in temporal lobe epilepsy via machine learning on brain images

Affiliations

Identification of four biotypes in temporal lobe epilepsy via machine learning on brain images

Yuchao Jiang et al. Nat Commun. .

Abstract

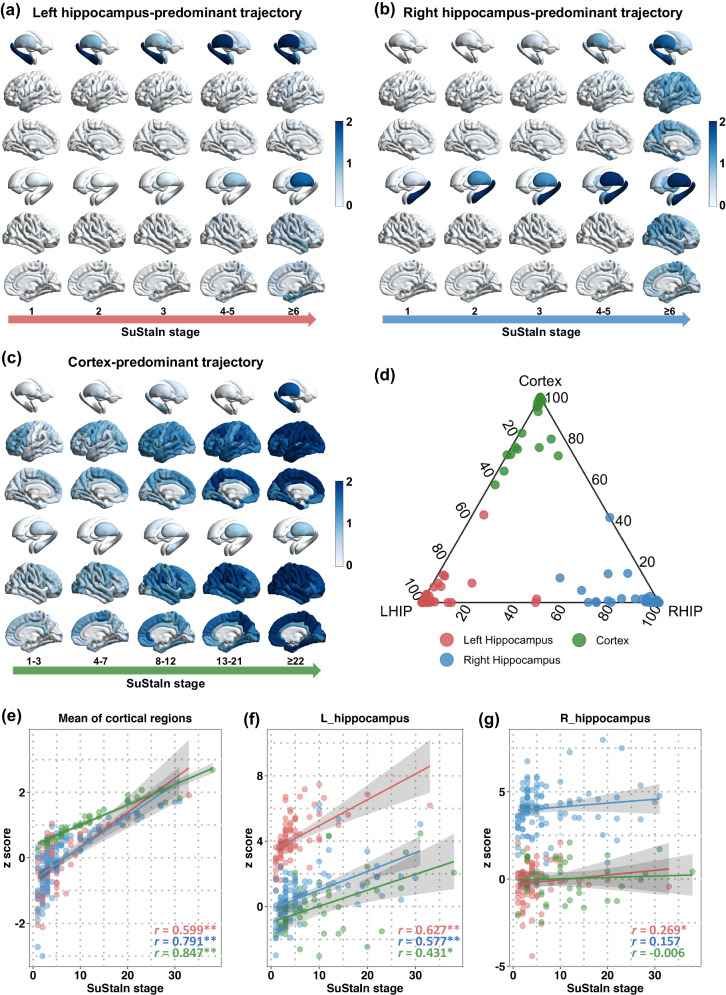
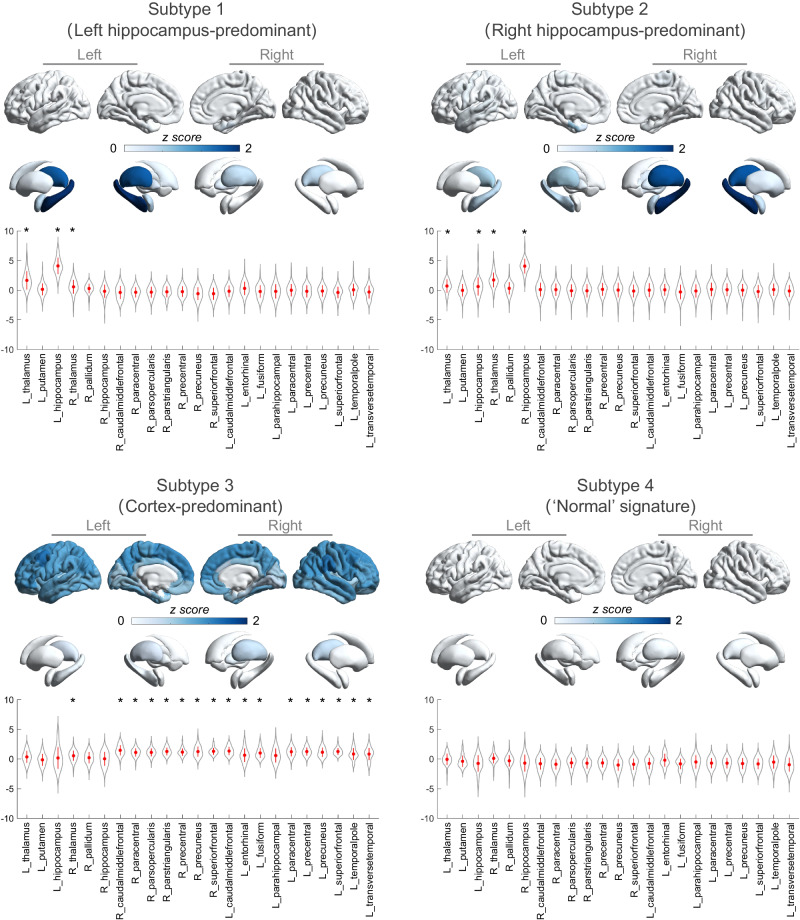
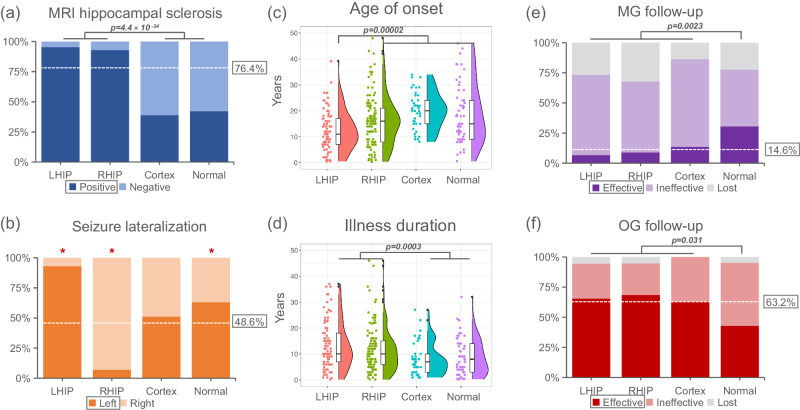
Artificial intelligence provides an opportunity to try to redefine disease subtypes based on similar pathobiology. Using a machine-learning algorithm (Subtype and Stage Inference) with cross-sectional MRI from 296 individuals with focal epilepsy originating from the temporal lobe (TLE) and 91 healthy controls, we show phenotypic heterogeneity in the pathophysiological progression of TLE. This study was registered in the Chinese Clinical Trials Registry (number: ChiCTR2200062562). We identify two hippocampus-predominant phenotypes, characterized by atrophy beginning in the left or right hippocampus; a third cortex-predominant phenotype, characterized by hippocampus atrophy after the neocortex; and a fourth phenotype without atrophy but amygdala enlargement. These four subtypes are replicated in the independent validation cohort (109 individuals). These subtypes show differences in neuroanatomical signature, disease progression and epilepsy characteristics. Five-year follow-up observations of these individuals reveal differential seizure outcomes among subtypes, indicating that specific subtypes may benefit from temporal surgery or pharmacological treatment. These findings suggest a diverse pathobiological basis underlying focal epilepsy that potentially yields to stratification and prognostication - a necessary step for precise medicine.


Conflict of interest statement

The author declares no competing interests.

Figures

Fig. 1
Fig. 1. Spatiotemporal patterns of progression of brain atrophy via SuStaIn.
Trajectory shows that cortical thickness or volume loss is firstly observed in the left hippocampus (a), the right hippocampus (b) and cortex (c) in people with temporal lobe epilepsy relative to healthy controls. The color of brain region reveals the severity of grey matter loss; white: unaffected areas (z < 1); light blue: mildly affected areas (z = 1–2); dark blue: severely affected areas (z > 2). d Individual subtyping according to the maximum probability of belonging to which ‘trajectory’ (red, left hippocampus-predominant trajectory; blue, right-hippocampus-predominant trajectory; green, cortex-predominant trajectory). eg Correlation between SuStaIn stages and z scores (i.e., the degree of thickness/volume decrease in patients relative to healthy population) of average cortical thickness, the volume of left and right hippocampus separately in each subgroup (red, left hippocampus-predominant trajectory; blue, right-hippocampus-predominant trajectory; green, cortex-predominant trajectory). Spearman correlation test is conducted for data analysis in figures e-g. It shows a significant correlation between SuStaIn stages and average cortical thickness (trajectory 1: r = 0.599, p = 1.4 × 10⁻⁹; trajectory 2: r = 0.791, p = 1.8 × 10⁻²⁵; trajectory 3: r = 0.847, p = 3.0 × 10⁻¹²), as well as the volume of the left hippocampus (trajectory 1: r = 0.627, p = 1.3 × 10⁻¹⁰; trajectory 2: r = 0.577, p = 2.3 × 10⁻¹¹; trajectory 3: r = 0.431, p = 0.005). The significant correlation between SuStaIn stages and right hippocampus volume was only found in the ‘trajectory’ 3 (trajectory 1: r = 0.269, p = 0.013; trajectory 2: r = 0.157, p = 0.097; trajectory 3: r = -0.006, p = 0.973). The error bands in figures (e, f, and g) represent 95% confidence interval. n = 85, 113, and 41 biologically independent samples in left hippocampus-predominant trajectory, right-hippocampus-predominant trajectory, and cortex-predominant trajectory. **p < 0.001, *p < 0.05, two-sided. Multiple comparisons were corrected by FDR.
Fig. 2
Fig. 2. Four distinct neuroanatomical signatures of brain atrophy patterning in people with temporal lobe epilepsy.
Subtype-specific signature in neuroanatomical pathology includes (1) the left hippocampus-predominant signature (subtype 1), (2) the right hippocampus-predominant signature (subtype 2), (3) the cortex-predominant signature (subtype 3) and (4) the ‘normal’ signature (subtype 4). ROI-wise z-scores are mapped to a brain template using visualization tools implemented in ENIGMA Toolbox (https://enigma-toolbox.readthedocs.io/en/latest/index.html). Color bar indicates z-scores (i.e., normative deviations) relative to the healthy control group. Note that a higher z-score represents a larger gray matter loss. Data in violin plot are presented as mean values +/− SD. Asterisk indicates significant regional volume reduction in subtype group compared to healthy control group using two-sided two sample t-test following FDR multiple comparisons correction. n = 85, 113, 41, and 57 biologically independent samples in the subtype 1, subtype 2, subtype 3 and subtype 4. In subtype 1, significant reductions are observed in left hippocampus (p = 2.9 × 10−43), left thalamus (p = 2.1 × 10⁻¹⁵) and right thalamus (p = 3.0 × 10⁻⁵). In subtype 2, significant reductions are found in right hippocampus (p = 7.2 × 10−62), left hippocampus (p = 4.7 × 10⁻⁵), left thalamus (p = 3.5 × 10⁻⁹) and right thalamus (p = 9.2 × 10⁻²⁸). In subtype 3, significant reductions are found in right thalamus (p = 7.2 × 10−62), right caudalmiddlefrontal (p = 1.8 × 10⁻¹³), right paracentral (p = 1.3 × 10⁻¹²), right parsopercularis (p = 4.5 × 10⁻¹³), right parstriangularis (p = 3.5 × 10⁻¹⁵), right precentral (p = 1.2 × 10⁻¹⁴), right precuneus (p = 2.5 × 10⁻¹¹), right superiorfrontal (p = 4.2 × 10⁻¹⁷), left caudal middle frontal (p = 6.6 × 10⁻¹⁵, left entorhinal (p = 1.2 × 10⁻³), left fusiform (p = 2.3 × 10⁻⁹), left paracentral (p = 2.0 × 10⁻¹²), left precentral (p = 3.3 × 10⁻¹⁴), left precuneus (p = 2.8 × 10⁻¹¹), left superiorfrontal (p = 2.7 × 10⁻¹⁷), left temporalpole (p = 3.9 × 10⁻⁶), and left transversetemporal (p = 1.0 × 10⁻⁵) regions.
Fig. 3
Fig. 3. Clinical characterization of subtypes.
a Proportion of TLE individuals with a visible hippocampal sclerosis on their magnetic resonance imaging (MRI) in each subtype. b Proportion of individuals with TLE whose seizure lateralization located at the corresponding left or right hemisphere. Red asterisk represents significant difference between a specific subtype vs. all other subtypes (subtype 1, p = 3.8 × 10⁻²²; subtype 2, p = 2.5 × 10⁻²⁹; subtype 3, p = 0.723; subtype 4, p = 0.015). c Differences of age of onset among four subtypes. d Differences of illness duration among four subtypes. e Proportion of individuals with seizure-free (i.e., effective), not seizure-free (i.e., ineffective) or lost follow-up in 144 medicated individuals (MG) at the follow-up (mean interval is 56.3 months). f Proportion of individuals with seizure-free (i.e., effective), not seizure-free (i.e., ineffective) or lost follow-up in 152 anterior temporal lobe operative individuals (OG) at follow-up (mean interval is 64.1 months). The white dotted line (a, b, e, and f) shows the average of the four subtypes. Data in figures (c and d) are presented using a box-plot (center line, median; box limits, upper and lower quartiles; whiskers, 1.5×interquartile range [IQR]; points, outliers). n = 85, 113, 41, and 57 biologically independent samples in the subtype 1, subtype 2, subtype 3 and subtype 4. Pearson’s Chi-square test is conducted for data analysis in figures a, b, e and f. Two-sided two-sample t test is used for data analysis in figures c and d. Multiple comparisons were considered with FDR correction. LHIP, left hippocampus-predominant signature (subtype1); RHIP, right hippocampus-predominant signature (subtype2); Cortex, the cortex-predominant signature (subtype3); Normal, the ‘normal’ signature (subtype4).

Similar articles

Cited by

References

    1. The L. ICD-11: a brave attempt at classifying a new world. Lancet. 2018;391:2476. doi: 10.1016/S0140-6736(18)31370-9. - DOI - PubMed
    1. Oren O, Gersh BJ, Bhatt DL. Artificial intelligence in medical imaging: switching from radiographic pathological data to clinically meaningful endpoints. Lancet Digit. Health. 2020;2:e486–e488. doi: 10.1016/S2589-7500(20)30160-6. - DOI - PubMed
    1. Rajpurkar P, Chen E, Banerjee O, Topol EJ. AI in health and medicine. Nat. Med. 2022;28:31–38. doi: 10.1038/s41591-021-01614-0. - DOI - PubMed
    1. Thijs RD, Surges R, O’Brien TJ, Sander JW. Epilepsy in adults. Lancet. 2019;393:689–701. doi: 10.1016/S0140-6736(18)32596-0. - DOI - PubMed
    1. Schmidt D, Schachter SC. Drug treatment of epilepsy in adults. BMJ. 2014;348:g254. doi: 10.1136/bmj.g254. - DOI - PubMed