. 2024 Mar 12;14(1):5974.
doi: 10.1038/s41598-024-55790-3.

Single-cell transcriptomics of the human parasite Schistosoma mansoni first intra-molluscan stage reveals tentative tegumental and stem-cell regulators

Affiliations

Single-cell transcriptomics of the human parasite Schistosoma mansoni first intra-molluscan stage reveals tentative tegumental and stem-cell regulators

Carmen L Diaz Soria et al. Sci Rep. .

Abstract

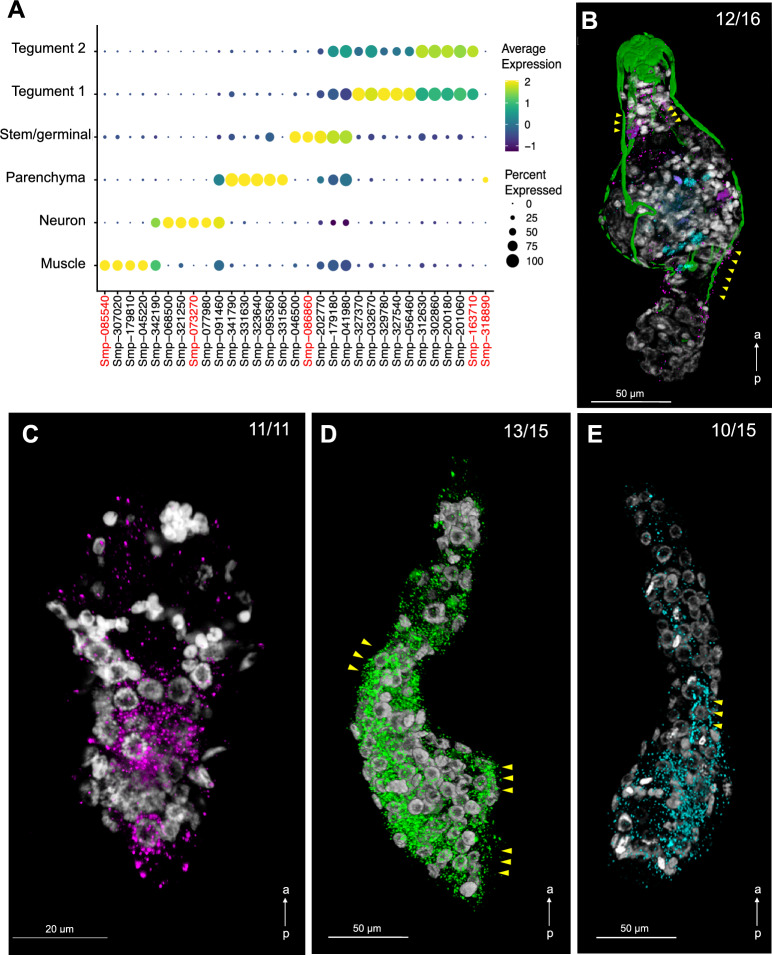
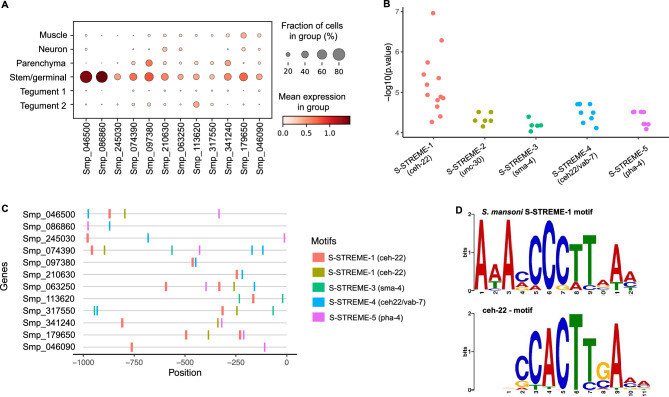
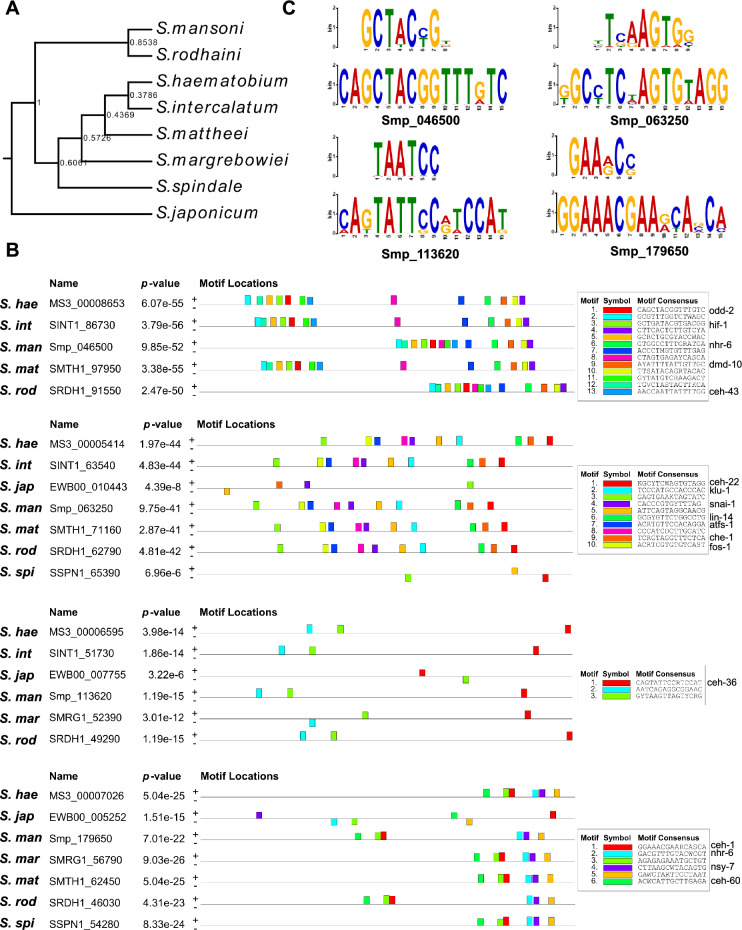
Schistosomiasis is a major Neglected Tropical Disease, caused by the infection with blood flukes in the genus Schistosoma. To complete the life cycle, the parasite undergoes asexual and sexual reproduction within an intermediate snail host and a definitive mammalian host, respectively. The intra-molluscan phase provides a critical amplification step that ensures a successful transmission. However, the cellular and molecular mechanisms underlying the development of the intra-molluscan stages remain poorly understood. Here, single cell suspensions from S. mansoni mother sporocysts were produced and sequenced using the droplet-based 10X Genomics Chromium platform. Six cell clusters comprising two tegument, muscle, neuron, parenchyma and stem/germinal cell clusters were identified and validated by in situ hybridisation. Gene Ontology term analysis predicted key biological processes for each of the clusters, including three stem/germinal sub-clusters. Furthermore, putative transcription factors predicted for stem/germinal and tegument clusters may play key roles during parasite development and interaction with the intermediate host.


Conflict of interest statement

Carmen Diaz Soria is currently employed at bit.bio, a cell coding company. All the experiments and analyses performed in this study occurred before Carmen Diaz Soria started to work at bit.bio. All other authors have no competing interest to declare.

Figures

Figure 1
Figure 1
Six distinct cell populations identified in D5 mother sporocysts. (A) Representative picture of D5 sporocyst in DIC bright field (left), DAPI-fluorescent field (centre) and merged (right). Scale bar: 50 μm. (B) Uniform Manifold Approximation and Projection (UMAP) representation of 601 single cells from D5 sporocysts. The cell clusters are coloured and labelled as indicated. The list of the Seurat marker genes in all cell clusters is provided in Supplementary Table S3. (C) Gene ontology (GO) enrichment analysis for biological processes only (marker genes with minimum AUC = 0.7, and GO terms supported by ≥ 2 genes), for top marker genes in each indicated colour-coded cell cluster (as shown in B). Only statistically significant GO enriched biological processes are depicted (− log10 (FDR < 0.05)). FDR: False Discovery Rate. Full names of GO terms indicated with *: purine ribonucleoside diphosphate metabolic process (GO:0009179), glutamine family amino acid biosynthetic process (GO:0009084), regulation of cellular macromolecule biosynthetic process (GO:2000112), pyrimidine nucleotide biosynthetic process (GO:0006221), pyrimidine nucleoside triphosphate metabolic process (GO:0009147). Full data provided in Supplementary Tables S4 and S5, for non-specificity filtering analysis with AUC = 0.7 and AUC = 0.6, respectively.
Figure 2
Figure 2
Cell clusters spatially validated by fluorescence in situ hybridization (FISH). (A) Dot plot showing the expression of the top 5 markers identified for each cell cluster. The average gene expression level for each marker is represented by a colour gradient from dark blue (low expression) to bright yellow (high expression). The circle sizes indicate the percentage of cells in each indicated cluster. The top marker genes for each cluster were defined as the highest AUC scores, which are calculated using FindAllMarkers (Seurat) using both presence and absence, and the level of expression. FISH probes for the following cluster-specific markers (highlighted in red) were used for spatial validation: Pan-tegument, micro-exon gene 6 or MEG-6 (Smp_163710); Muscle, myosin heavy chain (Smp_085540); Stem/Germinal, histone H2A (Smp_086860); Parenchyma, hypothetical protein (Smp_318890); and Neuron, neuroendocrine protein 7b2 (Smp_073270). Full data for the indicated top markers are provided in Supplementary Table S15. (B) Double FISH with myosin heavy chain (Smp_085540; magenta) and neuroendocrine protein 7b2 (Smp_073270; cyan) probes identified muscle and neuron cell clusters, respectively. Phalloidin-stained actin filaments are shown in green and DAPI staining in grey. Yellow arrowheads indicate co-localisation of myosin heavy chain and actin filaments. n = 16 parasites. (C) Localisation of the stem/germinal cells using FISH with histone H2A (Smp_086860; magenta). DAPI staining in grey. n = 11 parasites. (D) Localisation of tegumental cells using FISH with MEG-6 (Smp_163710; green). DAPI staining in grey. Yellow arrowheads indicate cells lining the surface of the parasites. n = 15 parasites. (E) Localisation of parenchyma cells using FISH with hypothetical protein (Smp_318890; cyan). DAPI staining in grey. Yellow arrowheads point to cytoplasmic projections containing Smp_318890 transcripts. n = 15 parasites. Scale bars: 50 μm in panels (B), (D), (E), and 20 μm in panel (C). a ← p: anterior–posterior axis.
Figure 3
Figure 3
Stem/germinal cell sub-clusters. (A) Clustering of the sporocyst data using the self-assembling manifold (SAM) algorithm for all cells (left) and for the Stem/germinal cluster only (right). The SAM algorithm with Leiden clustering identified three stem/germinal subclusters (0, 1 and 2). The lists of SAM topology genes for all cell clusters or stem/germinal cell cluster only are provided in Supplementary Tables S16 and S17, respectively. (B) Heatmap of expression of the top 5 marker genes identified in each of the three stem/germinal subclusters. The average gene expression level for each marker is represented by a colour gradient from dark blue (low expression) to bright yellow (high expression). The full list of top marker genes identified by Scanpy in the three SAM stem cell subclusters is provided in Supplementary Table S18. (C) Interaction network analysis by STRINGdb for stem/germinal subcluster 0. The coloured nodes of the network represent proteins (genes ID for each protein are indicated, and all splice isoforms or post-translational modifications for each protein are collapsed). The coloured edges indicate sources of the interaction evidence as described. The full list of all enriched String terms for the top 50 markers of each stem/germinal sub-cluster is provided in Supplementary Table S19. (D) Stem/germinal subcluster gene ontology (GO) enrichment analysis in the category biological process, for top marker genes in each indicated colour-coded cell cluster. Only statistically significant GO enriched biological processes are depicted (− log10 (FDR < 0.05)), and only terms supported by ≥ 2 genes are shown. FDR: False discovery rate. Full names of GO terms indicated with *: carbohydrate derivative catabolic process (GO:1901136), purine ribonucleoside monophosphate biosynthetic process (GO:0009168). Full data provided in Supplementary Table S20.
Figure 4
Figure 4
Promoter motif and transcription factor binding sites in stem/germinal cells. (A) Dot plot showing the expression level of the 12 Stem/germinal cell cluster-specific marker genes used for the analysis. Fraction of cells (%) and mean expression are indicated. The average gene expression level for each marker is represented by a colour gradient from white (low expression) to dark red (high expression). (B) Distribution of the − log10 (p values) for the top 5 ranked motifs identified in the 12 stem/germinal cell marker genes. The x-axis indicates motif names from XSTREME and significant match (p < 0.05) to known Transcription Factors Binding Sites (TFBSs) in the JASPAR 2022 nematode dataset (https://jaspar.genereg.net/downloads/). The y-axis represents log-transformed p values of each motif site shown in C. Full data provided in Supplementary Tables S21 and S22. (C) Predicted position distribution of the top 5 ranked motifs along the promoter region of the stem/germinal cell marker genes. The promoter region was taken as 1 kb upstream of the Transcription Start Site (TSS). Full data provided in Supplementary Table S23. (D) TF binding motifs found enriched in the promoter region of stem/germinal cell cluster marker genes. Schistosoma mansoni enriched motif named S-STREME-1 with the sequence: 1-AAAMCCCTTAAM (top) found in 11 of the 12 stem/germinal cell cluster marker genes with significant match to the binding site MA0264.1 (MA0264.1.ceh-22) for C. elegans ceh-22 (bottom) in the JASPAR database (https://jaspar.genereg.net/). The height of the letter in the motif scheme represents the frequency of the nucleotide observed in each indicated position.
Figure 5
Figure 5
Promoter motif conservation of stem/germinal cell genes in the Schistosomatidae family. (A) Rooted species tree inferred with Orthofinder, showing the phylogenetic relationship between the indicated species. Branch support values are indicated. (B) Motifs found enriched in the promoter region of the orthologs in Schistosomidae to the S. mansoni marker genes Smp_046500, Smp_063250, Smp_113620 and Smp_179650. The full list of analysed orthologous genes is provided in Supplementary Table S25. The colour-coded motifs detected for each group of orthologs are indicated along the 1 kb region upstream of the Transcription Start Site (TSS) for each gene. Significant matches with binding site found for C. elegans in the JASPAR database (https://jaspar.genereg.net/) were annotated. Full data provided in Supplementary Table S27. S. hae: S. haematobium, S. int: S. intercalatum, S. man: S. mansoni, S. mat: S. mattheei, S mar: S. margrebowiei, S. rod: S. rodhaini, S. spi: S. Spindale, S. jap: S. japonicum. (C) Logo of most significant motifs identified for each group of promoter regions of orthologous genes and the corresponding binding site for C. elegans in the JASPAR database (https://jaspar.genereg.net/). Sequence CAGCTACGGTTTGTC (bottom) found in orthologs of Smp_046500 showed a significant match to the binding site MA2148.1 (MA2148.1.odd-2) for C. elegans odd-2 (top); sequence KGCYTCWAGTGTAGG (bottom) found in orthologs of Smp_063250 showed a significant match to the binding site MA0264.2 (MA0264.2.ceh-22) for C. elegans ceh-22 (top); sequence CAGTATTCCRTCCAT (bottom) found in orthologs of Smp_113620 showed a significant match to the binding site MA2159.1 (MA2159.1.ceh-36) for C. elegans ceh-36 (top); sequence GGAAACGAARCASCA (bottom) identified in orthologs of Smp_179650 showed a significant match to the binding site MA0260.1 (MA0260.1.che-1) for C. elegans che-1 (top). The height of the letter in the motif scheme represents the frequency of the nucleotide observed in each indicated position.

Similar articles

Cited by

References

    1. Ayabina, D. V. et al. Gender-related differences in prevalence, intensity and associated risk factors of Schistosoma infections in Africa: A systematic review and meta-analysis. PLoS Negl. Trop. Dis.15, e0009083. 10.1371/journal.pntd.0009083 (2021). - PMC - PubMed
    1. Lo, N. C. et al. Review of 2022 WHO guidelines on the control and elimination of schistosomiasis. Lancet Infect. Dis.22, e327–e335. 10.1016/S1473-3099(22)00221-3 (2022). - PubMed
    1. Vale, N. et al. Praziquantel for schistosomiasis: Single-drug metabolism revisited, mode of action, and resistance. Antimicrob. Agents Chemother.10.1128/AAC.02582-16 (2017). - PMC - PubMed
    1. Nanes Sarfati, D., Li, P., Tarashansky, A. J. & Wang, B. Single-cell deconstruction of stem-cell-driven schistosome development. Trends Parasitol.37, 790–802. 10.1016/j.pt.2021.03.005 (2021). - PMC - PubMed
    1. Rinaldi, G., Attenborough, T., Rawlinson, K. A. & Berriman, M. Schistosomes go single cell. Nat. Rev. Microbiol.20, 705. 10.1038/s41579-022-00810-0 (2022). - PubMed