. 2024 Mar 12;14(1):5966.
doi: 10.1038/s41598-024-56163-6.

Quantitative proteomics reveals tissue-specific, infection-induced and species-specific neutrophil protein signatures

Affiliations

Quantitative proteomics reveals tissue-specific, infection-induced and species-specific neutrophil protein signatures

Gabriel Sollberger et al. Sci Rep. .

Abstract

Neutrophils are one of the first responders to infection and are a key component of the innate immune system through their ability to phagocytose and kill invading pathogens, secrete antimicrobial molecules and produce extracellular traps. Neutrophils are produced in the bone marrow, circulate within the blood and upon immune challenge migrate to the site of infection. We wanted to understand whether this transition shapes the mouse neutrophil protein landscape, how the mouse neutrophil proteome is impacted by systemic infection and perform a comparative analysis of human and mouse neutrophils. Using quantitative mass spectrometry we reveal tissue-specific, infection-induced and species-specific neutrophil protein signatures. We show a high degree of proteomic conservation between mouse bone marrow, blood and peritoneal neutrophils, but also identify key differences in the molecules that these cells express for sensing and responding to their environment. Systemic infection triggers a change in the bone marrow neutrophil population with considerable impact on the core machinery for protein synthesis and DNA replication along with environmental sensors. We also reveal profound differences in mouse and human blood neutrophils, particularly their granule contents. Our proteomics data provides a valuable resource for understanding neutrophil function and phenotypes across species and model systems.


Conflict of interest statement

The authors declare no competing interests.

Figures
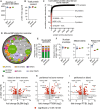
Figure 1
Figure 1
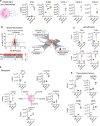
Mapping mouse tissue resident neutrophil proteomes. High-resolution quantitative mass spectrometry was used to characterise the proteomes of mouse neutrophils isolated from the bone marrow, blood and peritoneal cavity. (A) Number of proteins identified in each sample. (B) Total protein content of neutrophil populations. (C) Cumulative protein abundance for the bone marrow neutrophil proteome. Proteins were ranked according to their absolute copy number per cell. The number of proteins that make up 25%, 50%, 75% and 100% of the proteome is shown. (D) Overview of the mouse bone marrow proteome. Each protein is represented by a circle, with circle size indicating relative abundance. Granule proteins are subdivided into subsets while non-granule proteins are coloured grey. (E) The contribution of granule protein subsets to the total protein molecules expressed by neutrophils. (F) The contribution of nuclear envelope proteins (Gene Ontology term 0005635), mitochondrial proteins (Gene Ontology term 0005739) and ribosomal proteins (Kyoto Encyclopaedia of Genes and Genomes annotation 03010) to the total protein molecules expressed by neutrophils. (G) Comparison of bone marrow and blood neutrophils (H) bone marrow and peritoneal neutrophils and (I) blood and peritoneal neutrophils. For the volcano plots proteins were deemed to be significantly changing with a q value < 0.05 and a fold change > 2 (highlighted in red). The horizontal dashed line on volcano plots indicates q = 0.05. BM bone marrow, BL blood, PT peritoneal cavity. For each population 4 biological replicates were generated. Dot plots in a, b, and f show the mean ± standard deviation. For 1F statistical significance was determined using an unpaired, unequal variance t-test with Welch’s correction. ** indicates p < 0.01.
Figure 2
Figure 2
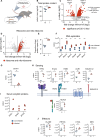
Tissue-specific neutrophil protein signatures. Murine neutrophils isolated from different tissues show enrichment in key processes. (A) The expression of innate immune response proteins C-X-C Motif Chemokine Ligand 1, 2 and 3 (CXCL1-3), Interleukin 1 Beta (IL1B) and Interleukin 36 Gamma (IL36G) in neutrophil populations. (B) The expression profile of ribosomal proteins (Kyoto Encyclopaedia of Genes and Genomes annotation 03010) in neutrophil populations. (C) The expression profile of a selection of proteins involved in cell adhesion in neutrophil populations. Fibrinogen Alpha Chain (FGA), Fibrinogen Beta Chain (FGB), Fibrinogen Gamma Chain (FGG) and Chemokine (C–C motif) ligand 6 (CCL6). (D) Protein copy numbers for a selection of cell surface receptors. L-selectin (SELL), C-Type Lectin Domain Family 4 Member E and D (CLEC4E and D), C-Type Lectin Domain Containing 7A (CLEC7A), Integrin Subunit Beta 3 (ITGB3). (E) The expression profile of 4 key transcription factors. CCAAT Enhancer Binding Protein Epsilon (CEBPE), CCAAT Enhancer Binding Protein Beta (CEBPB), JunB Proto-Oncogene AP-1 transcription factor subunit (JUNB) and Interferon Regulatory Factor 5 (IRF5). For each population 4 biological replicates were generated. Dot plots in a, c, d and e show the mean ± standard deviation. BM bone marrow, BL blood, PT peritoneal cavity. Statistical significance was determined using Limma with eBayes. The horizontal dashed line on volcano plot indicates q = 0.05. nd indicates when a protein was not detected, * indicates p < 0.05, ** indicates p < 0.01, ns indicates not significant.
Figure 3
Figure 3
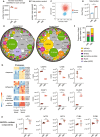
Systemic infection impacts core cellular processes and sensors in bone marrow neutrophils. (A) Mice were infected with Candida albicans and bone marrow neutrophils analysed by mass spectrometry 5 days post-infection. (B) Total protein content of neutrophil populations. (C) Comparison of bone marrow neutrophils isolated from infected versus non-infected mice. Proteins were deemed to be significantly changing with a q value < 0.05 and a fold change > 2 (highlighted in red). The horizontal dashed line on volcano plots indicates q = 0.05. (D,E) Expression profile of ribosomal and mitochondrial-ribosomal proteins in infected versus non-infected mice and the contribution that these proteins make to the total cellular protein molecules expressed. (F) The expression of MCM (Minichromosome Maintenance Complex Component) proteins in neutrophils isolated from the bone marrow of non-infected and infected mice. (G) CD101 abundance in neutrophils from non-infected versus infected mice. (H) The impact of C. albicans infection on the expression of sensing molecules in bone marrow neutrophils: Transferrin Receptor (TFRC), Integrin Subunit Alpha 4 (ITGA4), Integrin Subunit Beta 1 (ITGB1), C–C Motif Chemokine Receptor 1 (CCR1), Sialic Acid Binding Ig Like Lectin 12 (SIGLEC12) and NLR Family CARD Domain Containing 4 (NLRC4). (I) The abundance of serum amyloid proteins in neutrophils isolated from the bone marrow of non-infected and infected mice. (J) The impact of C. albicans infection on 4 key neutrophil effector molecules: Elastase (ELANE), Proteinase 3 (PRTN3), Cathepsin G (CTSG) and Myeloperoxidase (MPO). For each population 3 biological replicates were generated. Dot plots show the mean ± standard deviation. For 3C, D, F, G, H and J statistical significance was determined using Limma with eBayes. ns indicates not significant while * indicates p < 0.05, ** indicates p < 0.01. For 3B and E statistical significance was determined using an unpaired, unequal variance t-test with Welch’s correction. ni non-infected, i infected.
Figure 4
Figure 4
Species-specific neutrophil protein signatures. Comparison of mouse and human blood neutrophils. (A) Number of proteins identified in each sample. (B) Total protein content of neutrophil populations. (C) Analysis of forward and side scatter profile of human and mouse blood neutrophils by flow cytometry. (D) Geometric mean of neutrophil side scatter for human and mouse cells. (E) Overview of mouse and human blood neutrophil proteomes. Each protein is represented by a circle, with circle size indicating relative abundance. Granule proteins are subdivided into subsets while non-granule proteins are coloured grey. (F) The contribution of granule protein subsets to the total protein molecules expressed by mouse and human blood neutrophils. (G) The expression profile of a selection of proteases in mouse and human neutrophils. Caspase-1 (CASP1) Caspase-3 (CASP3), Cathepsin B (CTSB), Cathepsin G (CTSG), Cathepsin D (CTSD) and Elastase (ELANE). (H) The abundance of NADPH oxidase components in mouse and human neutrophils. For each population analysed by proteomics 4 biological replicates were generated. Dot plots show the mean ± standard deviation. mBL mouse blood, hBL human blood. For flow cytometry analysis of human and mouse blood neutrophils 3 biological replicates were analysed. Statistical significance was determined using an unpaired, unequal variance t-test with Welch’s correction. * indicates p < 0.05, ** indicates p < 0.01.
Figure 5
Figure 5
Human and mouse neutrophils differ in their expression of secreted molecules. (A) Interleukins and (B) chemokines that are differentially expressed across species. Interleukin 18 (IL18), Interleukin 16 (IL16), C-X-C Motif Chemokine Ligand 1, 2, 6 (CXCL1,2 and 6) and Chemokine (C–C motif) ligand 6 (CCL6). For each population 4 biological replicates were generated. Dot plots show the mean ± standard deviation. mBL mouse blood, hBL human blood. nd indicates when a protein was not detected. Statistical significance was determined using an unpaired, unequal variance t-test with Welch’s correction. * indicates p < 0.05, ** indicates p < 0.01.

References

    1. Amulic B, Cazalet C, Hayes GL, Metzler KD, Zychlinsky A. Neutrophil function: From mechanisms to disease. Annu. Rev. Immunol. 2012;30:459–489. doi: 10.1146/annurev-immunol-020711-074942. - DOI - PubMed
    1. Nordenfelt P, Tapper H. Phagosome dynamics during phagocytosis by neutrophils. J. Leukoc. Biol. 2011;90:271–284. doi: 10.1189/jlb.0810457. - DOI - PubMed
    1. Lacy P. Mechanisms of degranulation in neutrophils. Allergy Asthma Clin. Immunol. 2006;2:98–108. doi: 10.1186/1710-1492-2-3-98. - DOI - PMC - PubMed
    1. Burgener SS, Schroder K. neutrophil extracellular traps in host defense. Cold Spring Harb. Perspect. Biol. 2020;12:a37028. doi: 10.1101/cshperspect.a037028. - DOI - PMC - PubMed
    1. Brinkmann V, et al. Neutrophil extracellular traps kill bacteria. Science. 2004;303:1532–1535. doi: 10.1126/science.1092385. - DOI - PubMed