. 2024 Mar 12;14(1):5990.
doi: 10.1038/s41598-024-56579-0.

Tapping into the human spinal locomotor centres with transspinal stimulation

Affiliations

Tapping into the human spinal locomotor centres with transspinal stimulation

Andreas Skiadopoulos et al. Sci Rep. .

Abstract

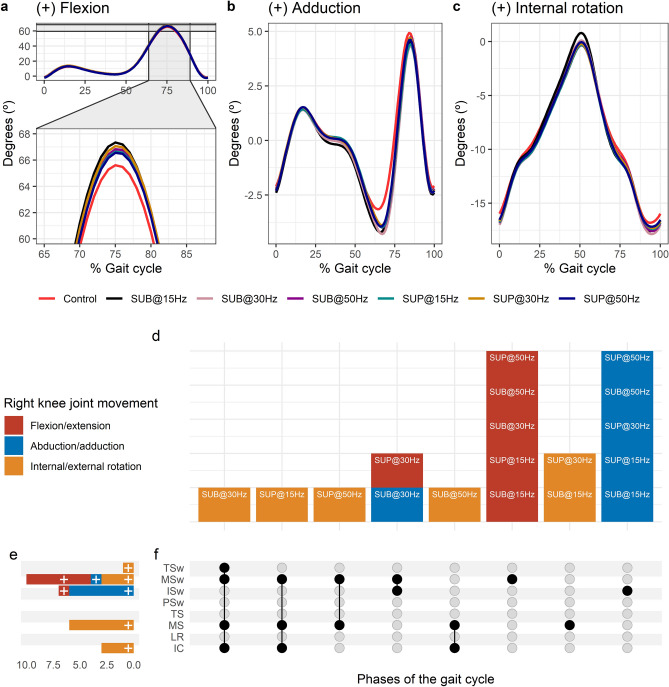
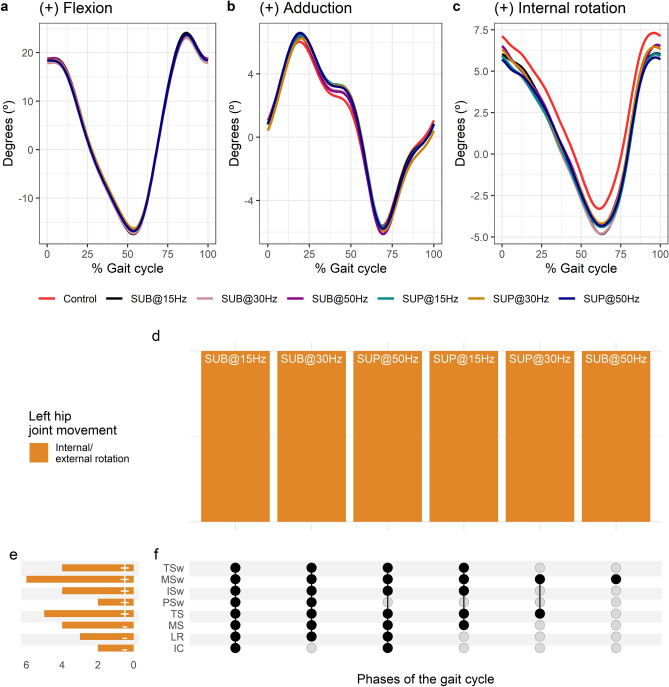
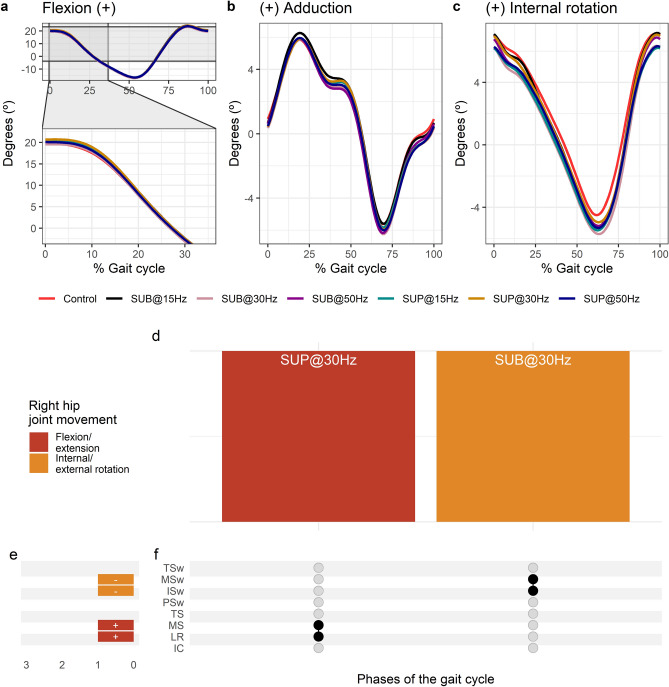
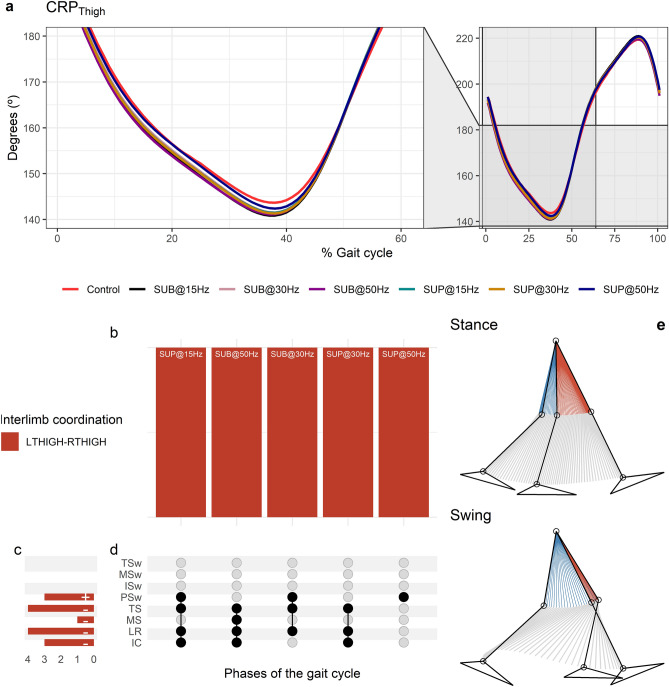
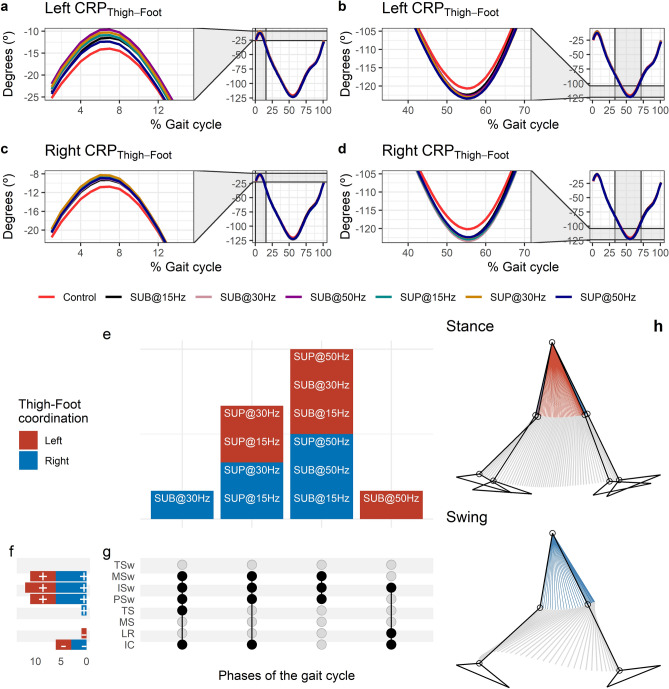
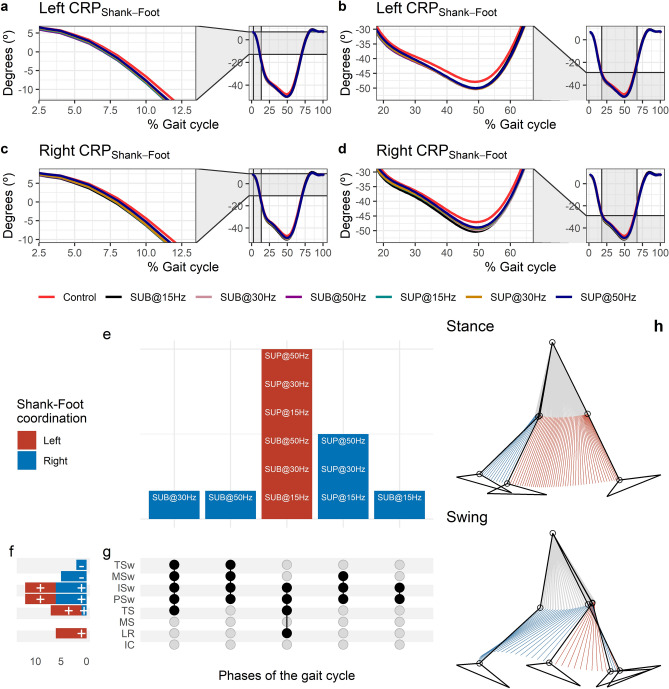
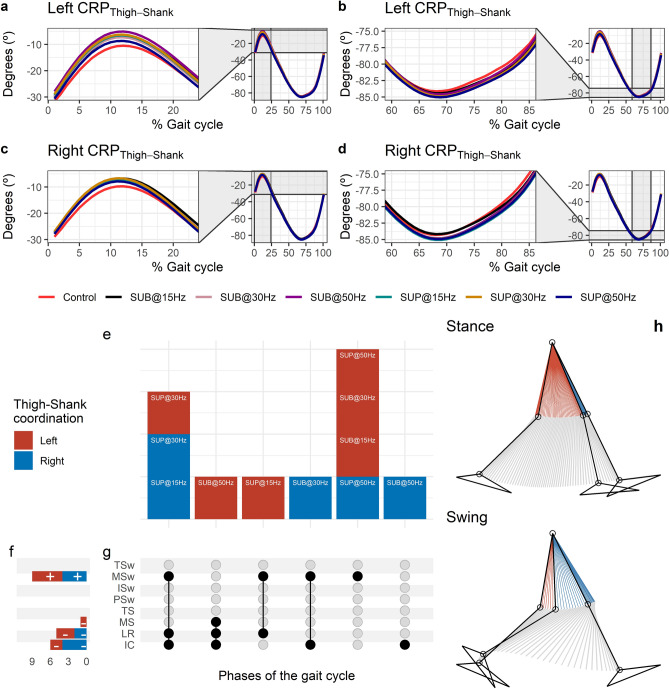
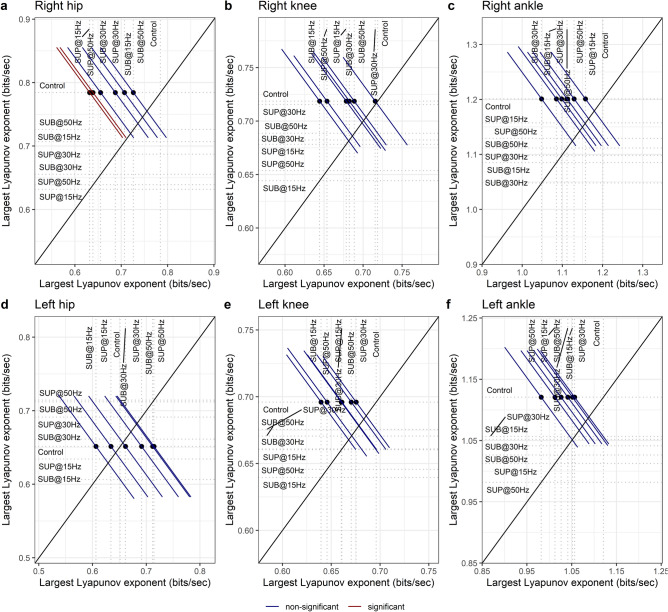
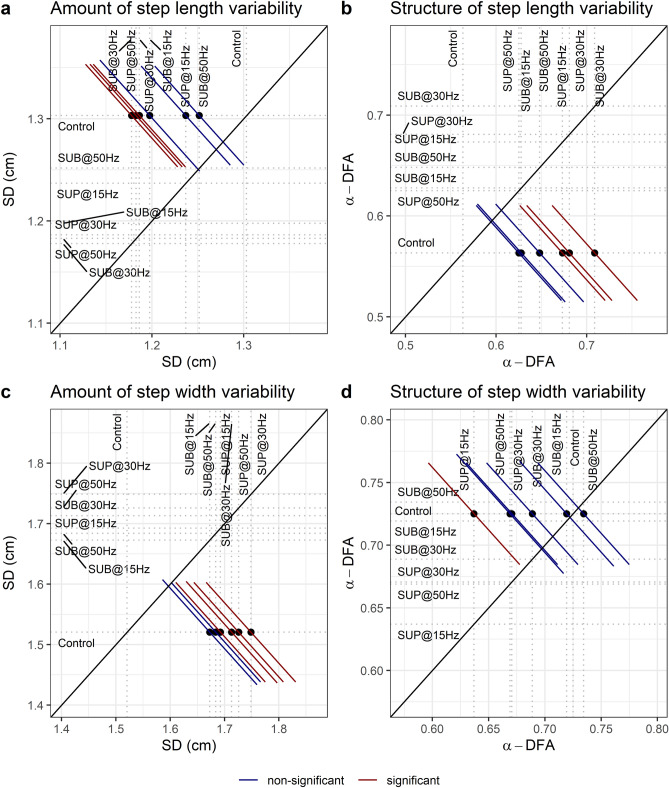
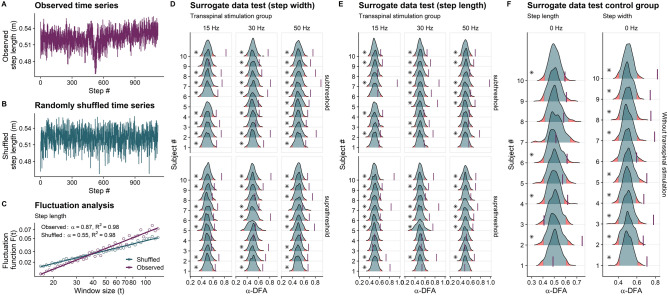
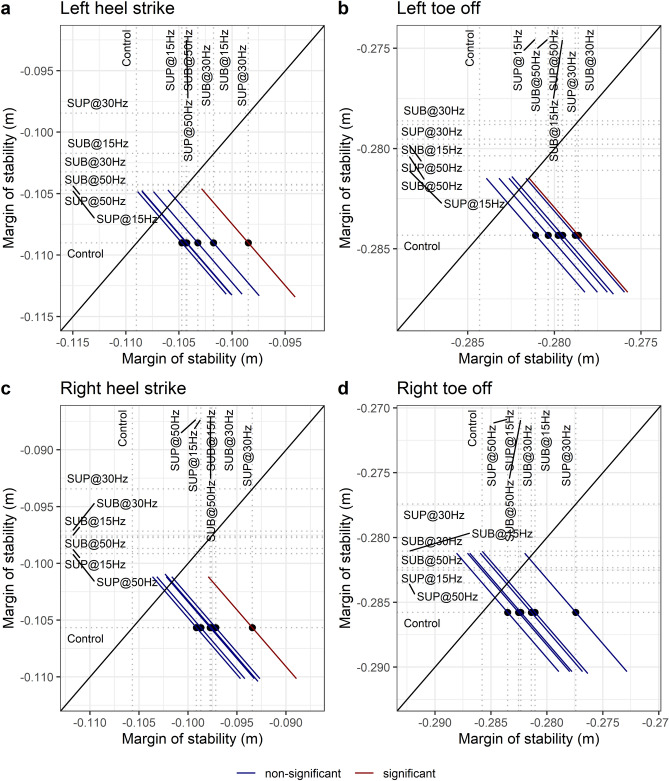
Human locomotion is controlled by spinal neuronal networks of similar properties, function, and organization to those described in animals. Transspinal stimulation affects the spinal locomotor networks and is used to improve standing and walking ability in paralyzed people. However, the function of locomotor centers during transspinal stimulation at different frequencies and intensities is not known. Here, we document the 3D joint kinematics and spatiotemporal gait characteristics during transspinal stimulation at 15, 30, and 50 Hz at sub-threshold and supra-threshold stimulation intensities. We document the temporal structure of gait patterns, dynamic stability of joint movements over stride-to-stride fluctuations, and limb coordination during walking at a self-selected speed in healthy subjects. We found that transspinal stimulation (1) affects the kinematics of the hip, knee, and ankle joints, (2) promotes a more stable coordination at the left ankle, (3) affects interlimb coordination of the thighs, and (4) intralimb coordination between thigh and foot, (5) promotes greater dynamic stability of the hips, (6) increases the persistence of fluctuations in step length variability, and lastly (7) affects mechanical walking stability. These results support that transspinal stimulation is an important neuromodulatory strategy that directly affects gait symmetry and dynamic stability. The conservation of main effects at different frequencies and intensities calls for systematic investigation of stimulation protocols for clinical applications.

Keywords: Dynamic stability; Interlimb coordination; Intralimb coordination; Locomotor networks; Motor control; Transspinal stimulation.


Conflict of interest statement

The authors declare no competing interests.

Figures

Figure 1
Figure 1
Methods for kinematic analysis during transspinal stimulation. (a) Experimental set up and placement of transspinal stimulation electrodes and reflective markers for tracking body segments. Subjects walked on a treadmill for 10 min while transspinal stimulation was delivered with a DS8R stimulator at 15, 30 and 50 Hz with 10 kHz carry over frequency at sub- and supra-threshold stimulation intensities. 3D kinematics were recorded for the lower limbs with an 8-camera optoelectronic system at 150 Hz. (b) Step length during walking was defined as the length between the left and right footprints at the time of heel contact. Step width during walking was defined as the mediolateral distance between two subsequent footprints. (c) Estimation of changes in step length and step width fluctuations as a function of timescale for the detrended fluctuation analysis (DFA). The demeaned and integrated spatiotemporal time series was divided into sequences of non-overlapping windows. A fitted linear regression line was subtracted from the data in each window (detrending), and the average of the local squared residuals was calculated for each window. This process was repeated for several different timescales or windows. A regression analysis was performed between the squared root of the average squared residual and the timescale to estimate the scaling exponent α-DFA. (d) Phase space reconstruction for the calculation of the largest Lyapunov exponent (LyE) of the joint angles using the method of delayed embedding. Optimal time delay (τ) and embedding dimension (m) parameters were calculated using the average mutual information and the false nearest neighbor algorithms. The 3D projection of the reconstructed phase space obtained with optimal embedding parameters τ = 24 and m = 3 for the right knee joint angle of a subject during control walking is shown. (e) Analytic signals were computed from the centered segment angles via Hilbert transformation. The continuous relative phase was calculated as the arctangent of the product of the analytic signal of the proximal angle with the conjugate analytic signal of the distal angle. The continuous relative phase estimation between the right thigh-shank coupling is shown. (f,g) Definition of the parameters used to compute margin of stability (MOS) at heel contact (f) and at toe-off (g). The margin of stability was calculated as the antero-posterior distance from the extrapolated center of mass (xCOM) to the lead heel (HEEL). Negative margin of stability means that the xCOM is ahead of the heel, while positive margin of stability means that the heel is ahead of the xCOM. COM: center of mass; xCOM: extrapolated center of mass; MOS: margin of stability.
Figure 2
Figure 2
Effects of transspinal stimulation on left ankle joint movement during walking. (ac) Left ankle joint movement with transspinal stimulation and during control walking. Solid lines represent group averages. (d) Vertical bars display which gait phases affected by transspinal stimulation in relation to joint movement. (e) Horizontal stacked bars display the cumulative number of transspinal stimulation effects on joint movement for each gait phase. Signs indicate the direction of angle change compared to control walking. (f) Each row corresponds to a specific gait phase, and each column represents a distinct set of gait phases. Black dots signify gait phases in which transspinal stimulation had significant effect on joint movement compared to control walking. Multiple black dots in a column indicate significant transspinal stimulation effects across different gait phases. SUB sub-threshold, SUP supra-threshold, IC initial contact, LR loading response, MS midstance, TS terminal stance, PSw pre-swing; ISw initial swing, MSw mid-swing, TSw terminal swing.
Figure 3
Figure 3
Effects of transspinal stimulation on right ankle joint movement during walking. (ac) Right ankle joint movement with transspinal stimulation and during control walking. Solid lines represent group averages. (d) Vertical bars display which gait phases affected by transspinal stimulation in relation to joint movement. (e) Horizontal stacked bars display the cumulative number of transspinal stimulation effects on joint movement for each gait phase. Signs indicate the direction of angle change compared to control walking. (f) Each row corresponds to a specific gait phase, and each column represents a distinct set of gait phases. Black dots signify gait phases in which transspinal stimulation had significant effect on joint movement compared to control walking. Multiple black dots in a column indicate significant transspinal stimulation effects across different gait phases. SUB sub-threshold, SUP supra-threshold, IC initial contact, LR loading response, MS midstance, TS terminal stance, PSw pre-swing; ISw initial swing, MSw mid-swing, TSw terminal swing.
Figure 4
Figure 4
Effects of transspinal stimulation on right knee joint movement during walking. (ac) Right knee joint movement with transspinal stimulation and during control walking. Solid lines represent group averages. (d) Vertical bars display which gait phases affected by transspinal stimulation in relation to joint movement. (e) Horizontal stacked bars display the cumulative number of transspinal stimulation effects on joint movement for each gait phase. Signs indicate the direction of angle change compared to control walking. (f) Each row corresponds to a specific gait phase, and each column represents a distinct set of gait phases. Black dots signify gait phases in which transspinal stimulation had significant effect on joint movement compared to control walking. Multiple black dots in a column indicate significant transspinal stimulation effects across different gait phases. SUB sub-threshold, SUP supra-threshold, IC initial contact, LR loading response, MS midstance, TS terminal stance, PSw pre-swing; ISw initial swing, MSw mid-swing, TSw terminal swing.
Figure 5
Figure 5
Effects of transspinal stimulation on left knee joint movement during walking. (ac) Left knee joint movement with transspinal stimulation and during control walking. Solid lines represent group averages. (d) Vertical bars display which gait phases affected by transspinal stimulation in relation to joint movement. (e) Horizontal stacked bars display the cumulative number of transspinal stimulation effects on joint movement for each gait phase. Signs indicate the direction of angle change compared to control walking. (f) Each row corresponds to a specific gait phase, and each column represents a distinct set of gait phases. Black dots signify gait phases in which transspinal stimulation had significant effect on joint movement compared to control walking. Multiple black dots in a column indicate significant transspinal stimulation effects across different gait phases. SUB sub-threshold, SUP supra-threshold, IC initial contact, LR loading response, MS midstance, TS terminal stance, PSw pre-swing; ISw initial swing, MSw mid-swing, TSw terminal swing.
Figure 6
Figure 6
Effects of transspinal stimulation on left hip joint movement during walking. (ac) Left hip joint movement with transspinal stimulation and during control walking. Solid lines represent group averages. (d) Vertical bars display which gait phases affected by transspinal stimulation in relation to joint movement. (e) Horizontal stacked bars display the cumulative number of transspinal stimulation effects on joint movement for each gait phase. Signs indicate the direction of angle change compared to control walking. (f) Each row corresponds to a specific gait phase, and each column represents a distinct set of gait phases. Black dots signify gait phases in which transspinal stimulation had significant effect on joint movement compared to control walking. Multiple black dots in a column indicate significant transspinal stimulation effects across different phases of gait. SUB sub-threshold, SUP supra-threshold, IC initial contact, LR loading response, MS midstance, TS terminal stance, PSw pre-swing; ISw initial swing, MSw mid-swing, TSw terminal swing.
Figure 7
Figure 7
Effects of transspinal stimulation on right hip joint movement during walking. (ac) Right hip joint movement with transspinal stimulation and during control walking. Solid lines represent group averages. (d) Vertical bars display which gait phases affected by transspinal stimulation in relation to joint movement. (e) Horizontal stacked bars display the cumulative number of transspinal stimulation effects on joint movement for each gait phase. Signs indicate the direction of angle change compared to control walking. (f) Each row corresponds to a specific gait phase, and each column represents a distinct set of gait phases. Black dots signify gait phases in which transspinal stimulation had significant effect on joint movement compared to control walking. Multiple black dots in a column indicate significant transspinal stimulation effects across different phases of gait. SUB sub-threshold, SUP supra-threshold, IC initial contact, LR loading response, MS midstance, TS terminal stance, PSw pre-swing; ISw initial swing, MSw mid-swing, TSw terminal swing.
Figure 8
Figure 8
Effects of transspinal stimulation on interlimb coordination during walking. (a) Continuous relative phase curves for left–right thigh interlimb coordination with transspinal stimulation and during control walking. A negative slope indicates that the right segment moves faster than the left segment, while a positive slope indicates that the left segment moves faster. A value of 180° indicates an out-of-phase relationship of the coupling. Solid lines represent group averages. (b) Vertical bars display which gait phases affected by transspinal stimulation in relation to interlimb coordination. (c) Horizontal stacked bars display the cumulative number of transspinal stimulation effects on interlimb coordination for each gait phase. Both positive (+) and (−) signs represent a shift to a less out-of-phase pattern. (d) Each row corresponds to a specific gait phase, and each column represents a distinct set of gait phases. (e) The stick diagram summarizes the reversal of thighs in phase space that occurred in stance and swing phases. Black dots signify gait phases in which transspinal stimulation had significant effect on interlimb coordination compared to control walking. Multiple black dots in columns indicate significant transspinal stimulation effects across different gait phases. SUB subthreshold, SUP suprathreshold, IC initial contact, LR loading response, MS midstance, TS terminal stance, PSw preswing, ISw initial swing, MSw midswing, TSw terminal swing.
Figure 9
Figure 9
Effects of transspinal stimulation on thigh-foot coordination during walking. (ad) Continuous relative phase curves for left and right thigh-foot intralimb coordination with transspinal stimulation and during control walking. Negative curve (°) indicates that the proximal segment is ahead of the distal segment in phase space. A negative slope indicates that the proximal segment moves faster than the distal segment, while a positive slope indicates that the distal segment moves faster than the proximal segment. A value of 0° indicates an in-phase relationship of the coupling, while a value of 180° indicates an anti-phase relationship. Solid lines represent group average. (e) Vertical bars display which gait phases affected by transspinal stimulation in relation to intralimb coordination. (f) Horizontal stacked bars display the cumulative number of transspinal stimulation effects on intralimb coordination for each gait phase. A positive (+) sign represents a shift to a greater anti-phase pattern, and a negative (−) sign a shift to a greater in-phase pattern. (g) Each row corresponds to a specific gait phase, and each column represents a distinct set of gait phases. Black dots signify gait phases in which transspinal stimulation had significant effect on intralimb coordination compared to control walking. Multiple black dots in columns indicate significant transspinal stimulation effects across different gait phases. (h) Stick figures of representative stride of a subject during walking. The red parts of the stick figures correspond to the phase when the thigh moves faster than the shank in phase space, and the blue parts when the shank moves faster than the thigh. SUB subthreshold, SUP suprathreshold, IC initial contact, LR loading response, MS midstance, TS terminal stance, PSw preswing, ISw initial swing, MSw midswing, TSw terminal swing.
Figure 10
Figure 10
Effects of transspinal stimulation on shank-foot coordination during walking. (ad) Continuous relative phase curves for left and right shank-foot intralimb coordination with transspinal stimulation and during control walking. Negative curve (°) indicates that the proximal segment is ahead of the distal segment in phase space. A negative slope indicates that the proximal segment moves faster than the distal segment, while a positive slope indicates that the distal segment moves faster than the proximal segment. A value of 0° indicates an in-phase relationship of the coupling, while a value of 180° indicates an anti-phase relationship. Solid lines represent group average. (e) Vertical bars display which gait phases affected by transspinal stimulation in relation to intralimb coordination. (f) Horizontal stacked bars display the cumulative number of transspinal stimulation effects on intralimb coordination for each gait phase. A positive (+) sign represents a shift to a greater anti-phase pattern, and a negative (−) sign a shift to a greater in-phase pattern. (g) Each row corresponds to a specific gait phase, and each column represents a distinct set of gait phases. Black dots signify gait phases in which transspinal stimulation had significant effect on intralimb coordination compared to control walking. Multiple black dots in columns indicate significant transspinal stimulation effects across different gait phases. (h) Stick figures of representative stride of a subject during walking. The red parts of the stick figures correspond to the phase where the thigh moves faster than the foot in phase space, and the blue parts where the foot moves faster than the thigh. SUB sub-threshold, SUP supra-threshold, IC initial contact, LR loading response, MS midstance, TS terminal stance, PSw pre-swing; ISw initial swing, MSw mid-swing, TSw terminal swing.
Figure 11
Figure 11
Effects of transspinal stimulation on thigh-shank coordination during walking. (a-d) Continuous relative phase curves for left and right thigh-shank intralimb coordination with transspinal stimulation and during control walking. Negative curve (°) indicates that the proximal segment is ahead of the distal segment in phase space. A negative slope indicates that the proximal segment moves faster than the distal segment, while a positive slope indicates that the distal segment moves faster than the proximal segment. A value of 0° indicates an in-phase relationship of the coupling, while a value of 180° indicates an anti-phase relationship. Solid lines represent group average. (e) Vertical bars display which gait phases affected by transspinal stimulation in relation to intralimb coordination. (f) Horizontal stacked bars display the cumulative number of transspinal stimulation effects on intralimb coordination for each gait phase. A positive (+) sign represents a shift to a greater anti-phase pattern, and a negative (−) sign a shift to a greater in-phase pattern. (g) Each row corresponds to a specific gait phase, and each column represents a distinct set of gait phases. Black dots signify gait phases in which transspinal stimulation had significant effect on intralimb coordination compared to control walking. Multiple black dots in columns indicate significant transspinal stimulation effects across different gait phases. (h) Stick figures of representative stride of a subject during walking. The red parts of the stick figures correspond to the phase where the thigh moves faster than the shank in phase space, and the blue parts where the shank moves faster than the thigh. SUB sub-threshold, SUP supra-threshold, IC initial contact, LR loading response, MS midstance, TS terminal stance, PSw pre-swing; ISw initial swing, MSw mid-swing, TSw terminal swing.
Figure 12
Figure 12
Effects of transspinal stimulation on Lyapunov exponent (LyE) of the (a) right hip, (b) right knee, (c) right ankle, (d) left hip, (e) left knee and, (f) left ankle joint. Mean-mean display of LyE values overprinted with their relative differences between transspinal stimulation and control walking. Dots show the intersection between mean values with simultaneous 95% confidence on the means. If a confidence interval crosses the diagonal line, the corresponding mean difference is non-significant. Diagonal line represents equality of means (SUB sub-threshold, SUP supra-threshold).
Figure 13
Figure 13
Effects of transspinal stimulation on the amount of variability of (a) step length and (c) step width fluctuations, estimated by the standard deviation (SD). Effects of transspinal stimulation on the temporal structure of variability of (b) step length and (d) step width fluctuations, estimated by the fractal exponent α-DFA. Mean-mean display of α-DFA and SD values overprinted with their relative differences between transspinal stimulation and control walking. Dots show the intersection between mean values with simultaneous 95% confidences on the means. If a confidence interval crosses the diagonal line, the corresponding mean difference is non-significant. Diagonal line represents equality of means (SUB sub-threshold, SUP supra-threshold).
Figure 14
Figure 14
Surrogation analysis. Surrogate data for step width and step length time series for each subject (#1–10) using the fractal scaling exponent (α-DFA) obtained from detrended fluctuation analysis (DFA) as the discriminating statistic. Ten-minute step length time series before (a) and after random permutation (b), and detrended fluctuation analyses (c) are shown for a representative walking trial with supra-threshold transspinal stimulation delivered at 15 Hz. The solid-colored lines in (c) are the best fit used to calculate the α-DFA value of the original and permuted time series. For the surrogate data test, the step width and step length time series of each walking trial was randomly permutated 399 times and the α-DFA value was calculated each time. The distribution of the surrogate α-DFA values (399 data) for each walking trial is shown in (d) for the step width and in (e) for the step length time series. (f) Step length and step width without transspinal stimulation for each subject. The α-DFA value of the original time series is shown with a vertical line, along with the probability density functions and the quantiles (2.5% and 97.5%) of the surrogates. Asterisks indicate that the α-DFA value for the original time series was significantly greater than α-DFA values for the corresponding surrogate time series, indicating a significant difference from uncorrelated white noise (*p ≤ 0.005).
Figure 15
Figure 15
Effects of transspinal stimulation on margin of stability at (a) left heel contact, (b) left toe off, (c) right heel contact, and (d) right toe off. Mean-mean display of margin of stability values overprinted with their relative differences between transspinal stimulation and control walking. Dots show the intersection between mean values with simultaneous 95% confidences on the means. If a confidence interval crosses the diagonal line, the corresponding mean difference is non-significant. Diagonal line represents equality of means. SUB sub-threshold, SUP supra-threshold.

Update of

Similar articles

Cited by

References

    1. Grillner S. Locomotion in vertebrates: Central mechanisms and reflex interaction. Physiol. Rev. 1975;55:247–304. doi: 10.1152/physrev.1975.55.2.247. - DOI - PubMed
    1. Grillner S. Control of locomotion in bipeds, tetrapods, and fish. In: Terjung R, editor. Comprehensive Physiology. Wiley; 2011. pp. 1179–1236.
    1. Kjaerulff O, Kiehn O. Distribution of networks generating and coordinating locomotor activity in the neonatal rat spinal cord in vitro: A Lesion Study. J. Neurosci. 1996;16:5777–5794. doi: 10.1523/JNEUROSCI.16-18-05777.1996. - DOI - PMC - PubMed
    1. Arber S. Motor circuits in action: Specification, connectivity, and function. Neuron. 2012;74:975–989. doi: 10.1016/j.neuron.2012.05.011. - DOI - PubMed
    1. Jessell TM. Neuronal specification in the spinal cord: inductive signals and transcriptional codes. Nat. Rev. Genet. 2000;1:20–29. doi: 10.1038/35049541. - DOI - PubMed