. 2024 Mar 12;14(1):5962.
doi: 10.1038/s41598-024-56568-3.

Impact of enriched environment on motor performance and learning in mice

Affiliations

Impact of enriched environment on motor performance and learning in mice

S Dijkhuizen et al. Sci Rep. .

Abstract

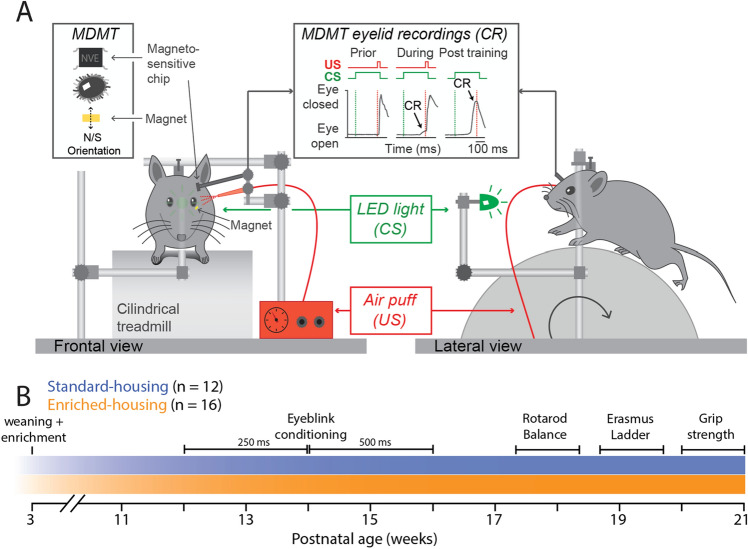
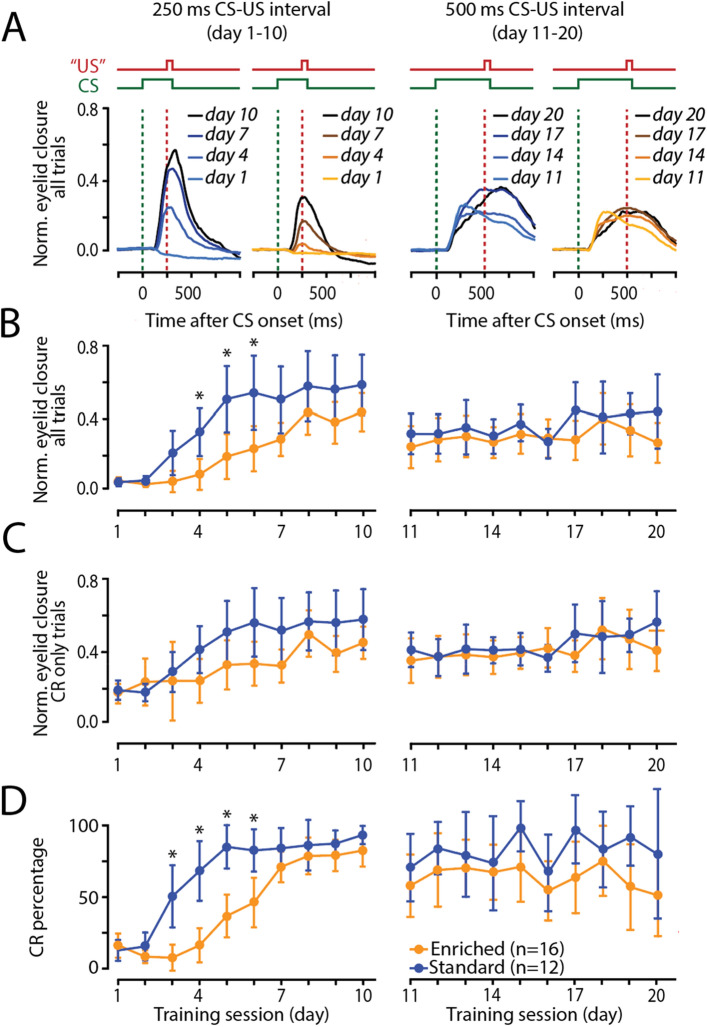
Neuroscience heavily relies on animal welfare in laboratory rodents as it can significantly affect brain development, cognitive function and memory formation. Unfortunately, laboratory animals are often raised in artificial environments devoid of physical and social stimuli, potentially leading to biased outcomes in behavioural assays. To assess this effect, we examined the impact of social and physical cage enrichment on various forms of motor coordination. Our findings indicate that while enriched-housed animals did not exhibit faster learning in eyeblink conditioning, the peak timing of their conditioned responses was slightly, but significantly, improved. Additionally, enriched-housed animals outperformed animals that were housed in standard conditions in the accelerating rotarod and ErasmusLadder test. In contrast, we found no significant effect of enrichment on the balance beam and grip strength test. Overall, our data suggest that an enriched environment can improve motor performance and motor learning under challenging and/or novel circumstances, possibly reflecting an altered state of anxiety.

Keywords: Cage enrichment; Delay eyeblink conditioning; ErasmusLadder; Mice; Physical enrichment; Rotarod; Social enrichment.


Conflict of interest statement

The authors declare no competing interests.

Figures

Figure 1
Figure 1
Eyeblink conditioning set-up and experimental timeline. (A) Mouse experimental eyeblink conditioning set-up. The conditional stimulus (CS) was a green LED light and the unconditional stimulus (US) was a mild air puff presented to the eye. Eyelid movements were recorded using MDMT, combined with high-speed video recordings (300 fps). During the experiments mice were head-fixed on top of a foam treadmill and able to walk freely. (B) Timeline of the performed experiments. From the age of three weeks enriched-housed mice (orange, n = 16) were socially and physically enriched, while standard-housed mice (blue, n = 12) were housed individually only with bedding and nesting material. All mice started with eyeblink conditioning, followed by the accelerating rotarod and balance beam test, then the ErasmusLadder, and finally the grip strength test. Abbreviations: CR conditioned response, CS conditioned stimulus, US unconditioned stimulus.
Figure 2
Figure 2
Enriched-housed mice have slower acquisition of eyeblink conditioned responses than standard-housed mice. (A) Group averaged eyeblink traces (blue: standard-housed mice, n = 12; orange: enriched-housed mice, n = 16) of four training sessions during the 250 ms ISI paradigm and four training sessions during the 500 ms ISI paradigm. (B) Normalized eyelid closure calculated over all trials (NECall_trials) for the first ten days of training with and ISI of 250 ms (left panel), and second ten days of training with an ISI of 500 ms. Standard-housed mice showed faster learning in the 250 ms ISI. (C) Normalized eyelid closure calculated over trials with a CR (NECCR_trials) for the first ten days of training with and ISI of 250 ms (left panel), and second ten days of training with an ISI of 500 ms. No group differences were found. (D) Percentage of conditioned responses for the first ten days of training with and ISI of 250 ms (left panel) and second ten days of training with an ISI of 500 ms. the 500 ms ISI (day 11–20). Standard-housed mice showed faster learning in the 250 ms ISI. Abbreviations: CR conditioned response, CS conditioned stimulus, US unconditioned stimulus. All error bars represent the 95% confidence interval. *Significance level p < 0.05 after correction Bonferroni-Holm.
Figure 3
Figure 3
Enriched-housed mice have slightly improved timing of their eyeblink conditioned responses than standard-housed mice. (A) Heat map showing the amplitude of conditioned responses (CR) per group. (B) Distribution of the latency to CR onset for training days 8–10 for the 250 ms ISI, and day 18–20 for the 500 ms ISI training paradigm. (C) Distribution of the latency to CR peak for training days 8–10 for the 250 ms ISI, and day 18–20 for the 500 ms ISI training paradigm. Note that in enriched-housed animals the CRs are more closely centered around the onset of the expected US for the 250 ms ISI paradigm. We defined a “perfectly timed” CR window, indicated with the black arrows. (D) Enriched-housed mice show a higher percentage of perfectly timed CR than standard-housed animals. This effect was only observed for the shorter 250 ms ISI training paradigm. (E) Correlation between latency to CR peak amplitude and peak timing for days 8–10 for the 250 ms ISI, and day 18–20 for the 500 ms ISI training. The blue line represents the regression line for the standard-housed mice, and the orange line represents the regression line for the enriched-housed mice. Abbreviations: CR conditioned response, CS conditioned stimulus, US unconditioned stimulus. *Significance level p < 0.05 after correction Bonferroni-Holm.
Figure 4
Figure 4
Enriched-housed animals perform better on accelerating rotarod, but not on the balance beam or grip strength tests. (A) Illustration of the balance beam test, where time crossing the beam from one side to the other was quantified on two different beam widths: 6 mm and 12 mm. (B) Boxplots of the average time (s) on the beam per group and beam width. Each dot represents a single value per mouse, with in total two values per beam width per mouse. (C) Illustration of the grip strength test, where the maximal muscle strength of the forelimbs was quantified by grabbing a bar from the grid before releasing. (D) Boxplots of the average peak strength (N) per group. Each dot represents a single value per mouse, with 8 values in total for each mouse. (E) Illustration of the accelerating rotarod, where the latency to fall was quantified. Mice had to walk on the accelerating rod (4–40 RPM) for a maximum of 300 s. (F) Line plot represent the average latency to fall (s) per trial per day, and error bars representing a 95% confidence interval. The blue data represents standard-housed mice, where the orange data represents the enriched-housed mice. *Significance level p < 0.05 after correction Bonferroni-Holm.
Figure 5
Figure 5
Enriched-housed animals perform better on the ErasmusLadder. (A) Illustration of the ErasmusLadder, where mice had to cross the horizontal ladder from one shelter box to the other. The percentage of “correct” steps within each trial was quantified, whereby a correct step was defined as a step of the front-paws from a high rung to the next high rung, irrespective of the length of the step. A step where a lower rung was touched upon, was considered as a misstep. (B) Histogram showing the distribution of correct steps for both groups. (C) Line plot representing the average correct steps (%) of individual mice (each line represents one animal). (D) Line plot representing the average correct steps (%) per group, and error bars representing a 95% confidence interval. The blue data represents standard-housed mice, where the orange data represents the enriched-housed mice. *Significance level p < 0.05 after Bonferroni-Holm correction.

Similar articles

Cited by

References

    1. Harlow HF. Total social isolation: Effects on macaque monkey behavior. Science. 1965;148:666–666. doi: 10.1126/science.148.3670.666-a. - DOI - PubMed
    1. Kaler SR, Freeman BJ. Analysis of environmental deprivation: Cognitive and social development in Romanian orphans. J. Child Psychol. Psychiatry. 1994;35:769–781. doi: 10.1111/j.1469-7610.1994.tb01220.x. - DOI - PubMed
    1. Kuhn CM, Schanberg SM. Responses to maternal separation: Mechanisms and mediators. Int. J. Dev. Neurosci. 1998;16:261–270. doi: 10.1016/S0736-5748(98)00034-3. - DOI - PubMed
    1. Würbel H. Ideal homes? Housing effects on rodent brain and behaviour. Trends Neurosci. 2001;24:207–211. doi: 10.1016/S0166-2236(00)01718-5. - DOI - PubMed
    1. Chapillon P, Manneché C, Belzung C, Caston J. Rearing environmental enrichment in two inbred strains of mice: 1. Effects on emotional reactivity. Behav. Genet. 1999;29:41–46. doi: 10.1023/A:1021437905913. - DOI - PubMed