. 2024 Jul;16(7):1052-1061.
doi: 10.1038/s41557-024-01467-3. Epub 2024 Mar 12.

RNA modulates hnRNPA1A amyloid formation mediated by biomolecular condensates

Affiliations

RNA modulates hnRNPA1A amyloid formation mediated by biomolecular condensates

Chiara Morelli et al. Nat Chem. 2024 Jul.

Abstract

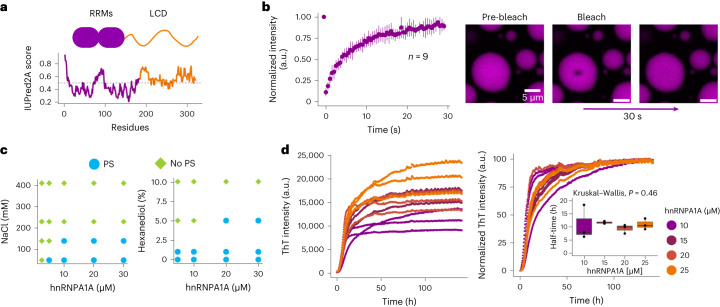
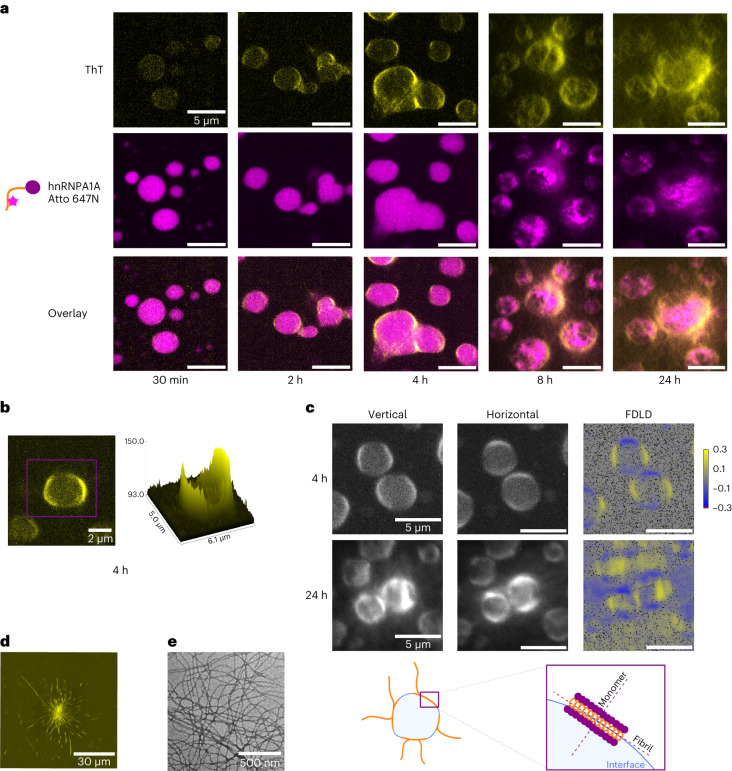
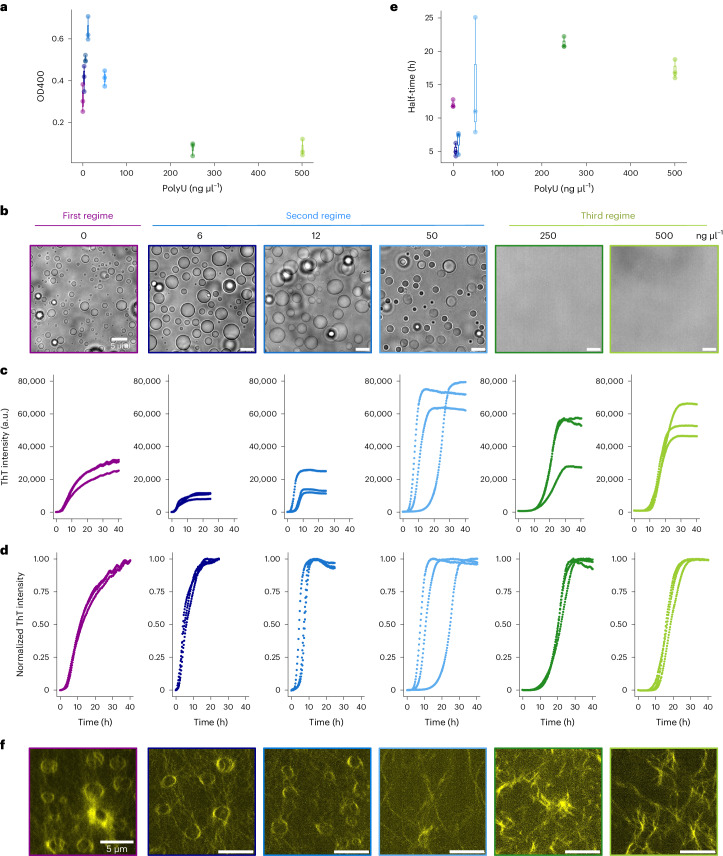
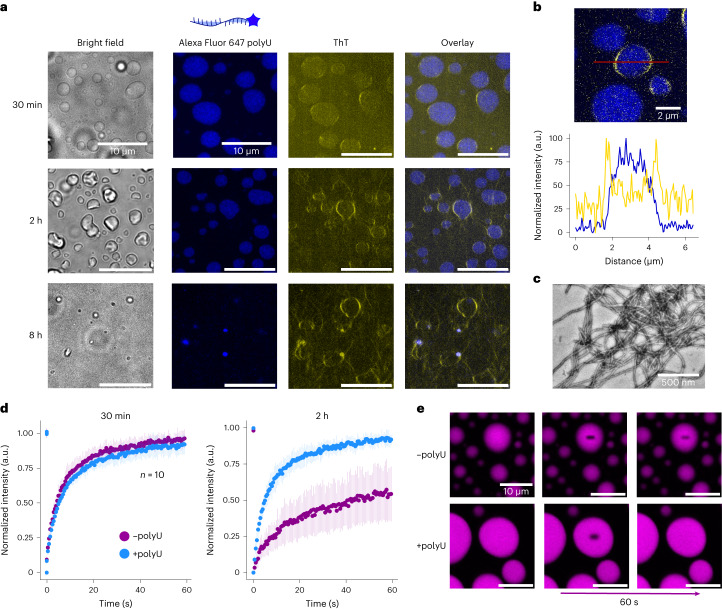
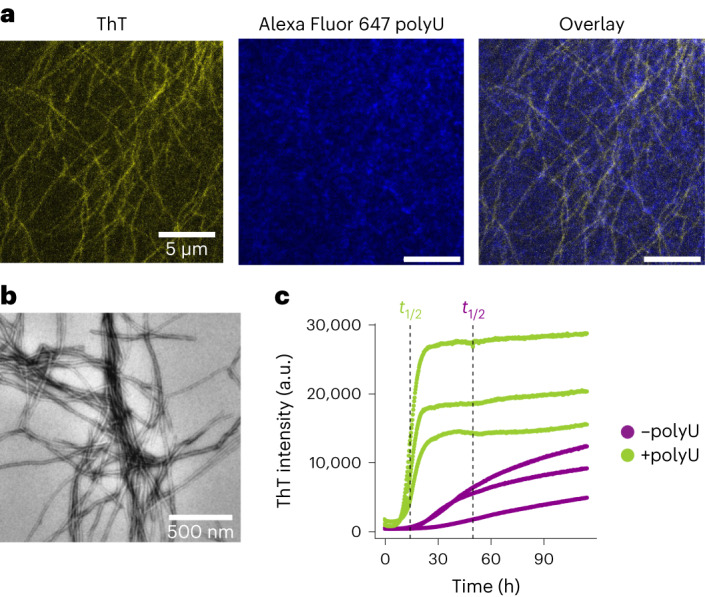
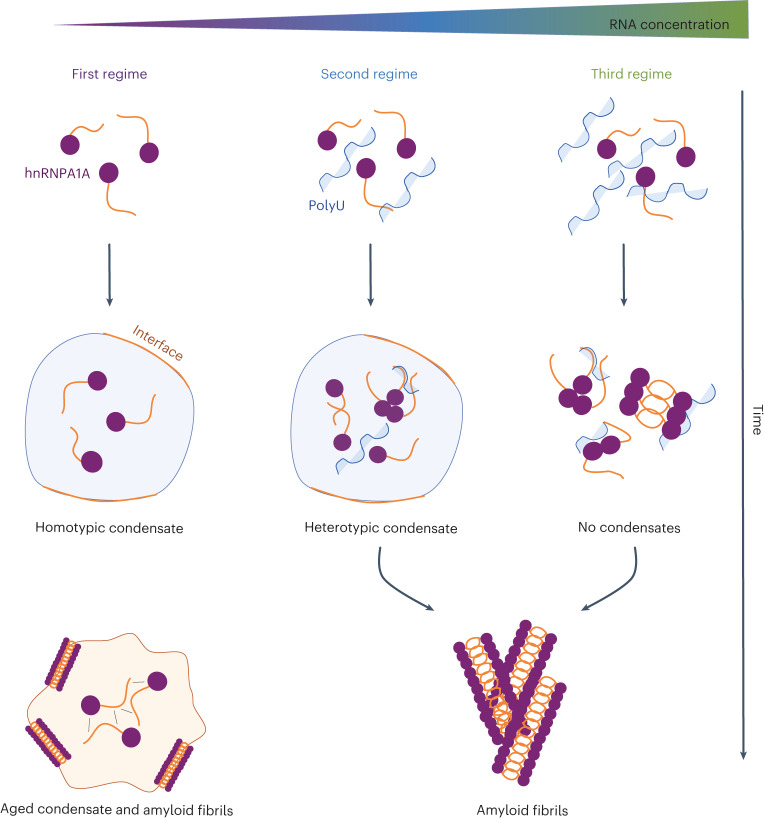
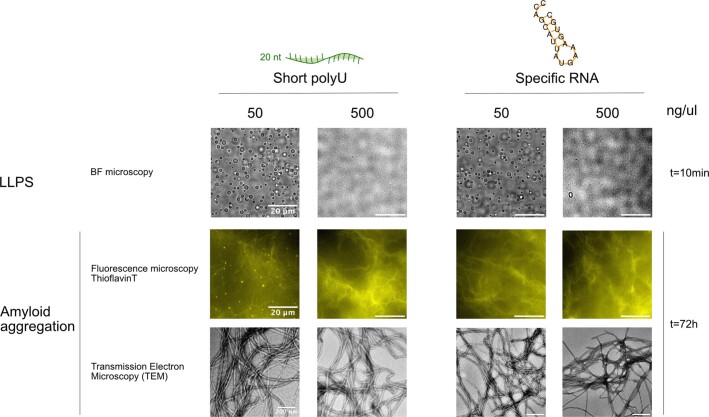
Several RNA binding proteins involved in membraneless organelles can form pathological amyloids associated with neurodegenerative diseases, but the mechanisms of how this aggregation is modulated remain elusive. Here we investigate how heterotypic protein-RNA interactions modulate the condensation and the liquid to amyloid transition of hnRNPA1A, a protein involved in amyothropic lateral sclerosis. In the absence of RNA, formation of condensates promotes hnRNPA1A aggregation and fibrils are localized at the interface of the condensates. Addition of RNA modulates the soluble to amyloid transition of hnRNPA1A according to different pathways depending on RNA/protein stoichiometry. At low RNA concentrations, RNA promotes both condensation and amyloid formation, and the catalytic effect of RNA adds to the role of the interface between the dense and dilute phases. At higher RNA concentrations, condensation is suppressed according to re-entrant phase behaviour but formation of hnRNPA1A amyloids is observed over longer incubation times. Our findings show how heterotypic nucleic acid-protein interactions affect the kinetics and molecular pathways of amyloid formation.


Conflict of interest statement

The authors declare no competing interests.

Figures

Fig. 1
Fig. 1. Phase separation mediates hnRNPA1A amyloid formation.
a, Schematic structure of hnRNPA1A, consisting of the folded RRMs and the disordered LCD, as shown by the online predictor of disordered structures IUPred2A (https://iupred2a.elte.hu). b, (right) FRAP experiments on condensates within 30 min of incubation, showing ~98% signal recovery. Data points represent the mean, and error bars show standard deviations of measurements from nine individual condensates from three technical replicates (n = 9). The experiment was repeated for two different protein batches yielding similar results. The hnRNPA1A concentration was 20 μM, and the buffer composition was 20 mM Tris, pH 7.5 and 2 mM β-mercaptoethanol. This buffer was used for all the following experiments unless otherwise stated. (left) Representative confocal microscopy images before and after photobleaching. c, The hnRNPA1A phase diagrams as a function of ionic strength and 1,6-hexanediol concentration. PS, phase separation. Phase diagrams were performed with two different protein batches showing similar trends. d, Raw and normalized ThT profiles at different protein concentrations. The inset shows a box plot with half-times calculated from normalized curves as the time needed to reach 50% of maximum fluorescence intensity. According to the non-parametric Kruskal–Wallis test (P value = 0.46), there is no significant difference between aggregation half-times calculated from reactions with different protein concentrations. This experiment was repeated for three different protein batches yielding similar results; that is, no dependence of half-times on protein bulk concentration was observed. Source data
Fig. 2
Fig. 2. The hnRNPA1A amyloids localize at the interface of the condensates.
a, Re-scan confocal microscopy images at different time points during hnRNPA1A aggregation mediated by condensation. The protein bulk concentration was 10 μM, and this concentration was used for all the following experiments unless otherwise stated. The top row shows the fluorescence intensity of ThT, reporter for amyloid fibrils. The middle row shows the fluorescence intensity of Atto 647N hnRNPA1A. The bottom row shows an overlay of the ThT and Atto 647N hnRNPA1A fluorescence intensities. Already after 2 h, there is a change in the ThT fluorescence intensity at the interface of the condensates. At later time points, it is possible to notice fibrils emerging from the condensates. This experiment was repeated with at least three protein batches. We always observed a higher ThT signal at the interface of the condensates, but the timescale of fibril formation varied by 3–4 h. b, A confocal microscopy image and the corresponding intensity profile showing the strong ThT fluorescence signal at the interface of the condensates after 4 h of incubation. c, FDLD imaging reveals a preferential orientation of ThT, indicating that fibrils align parallel to the interface of the condensates. Following an additional 24 h of incubation, the fibrils continue to grow normally towards the interface. ‘Vertical’ and ‘horizontal’ refer to the polarization of the excitation beam. FDLD values are colour-coded in the image from yellow (vertically oriented) to blue (horizontally oriented). Grey values indicate no preferential orientation. The schematic diagram below the microscopy images shows how fibrils and proteins may be oriented with respect to the interface of the condensates. This experiment was independently conducted twice, with each run comprising two technical replicates, using the same protein batch. d, Confocal microscopy image of amyloid starbust structure visualized after 4–6 days of incubation, using ThT as the fluorescent reporter. These structures were consistently observed with at least three distinct protein preparations when amyloid aggregation was mediated by condensation. e, TEM image of hnRNPA1A amyloid fibrils after 6 days of incubation. TEM imaging of fibrils was performed on at least three different protein batches, yielding fibrils with a similar morphology.
Fig. 3
Fig. 3. PolyU modulates hnRNPA1A condensation and amyloid formation in a concentration-dependent manner.
a, The change in volume of the hnRNPA1A dense phase at a fixed bulk concentration as measured by turbidity (OD400, the optical density at 400 nm) in the presence of increasing polyU concentrations. Turbidity measurements were performed in technical triplicates (n = 3) and with two distinct protein preparations, yielding similar results. b, Bright-field microscopy images showing the absence and presence of protein condensates at different polyU concentrations and constant protein concentration after 30 min of incubation. Accordingly, we delineate three different regimes: (1) condensation driven by homotypic interactions; (2) condensation driven by both homotypic and heterotypic protein–RNA interactions; and (3) re-entrant phase and absence of condensation. The regimes are colour-coded in all figures by purple, blue and green colours, respectively. Bright-field imaging was always performed in parallel with turbidity measurements to confirm the presence of condensates, and was therefore repeated for two different protein preparations. c,d, Raw and normalized ThT profiles of hnRNPA1A at increasing concentrations of polyU. The experiment was performed with three protein batches, each with three technical replicates. e, Half-times of hnRNPA1A aggregation kinetics calculated from the normalized curves shown in d as a function of polyU concentration (n = 3). f, Re-scan confocal microscopy images of end-point samples (48 h), using ThT as fluorophore. Fibrils are rearranged in a circular shape resembling the structure of the condensates only in the absence or at a very low concentration of polyU. Confocal imaging was performed for each condition at the end of the aggregation reaction to visualize fibrils, and was repeated for two different protein preparations. Source data
Fig. 4
Fig. 4. Fibril formation within heterotypic condensates.
a, Bright-field and re-scan confocal images of hnRNPA1A condensates in the presence of 50 ng μl–1 polyU labelled with Alexa Fluor 647 Hydrazide. This condition was taken as representative of the second regime, colour-coded with blue in Fig. 3. Already after 30 min, we observe a higher ThT signal at the interface of heterotypic condensates. In this condition, condensates dissolve completely or partially, and within a few hours are replaced by amyloid fibrils. Imaging of hnRNPA1A aggregation in the presence of labelled polyU was performed with two distinct protein preparations. The time of condensate dissolution varied by a few hours depending on the protein batch. b, Confocal image and corresponding intensity profiles showing a higher ThT signal at the interface of hnRNPA1A condensates after 2 h of incubation, while labelled polyU is uniformly distributed. c, TEM image of hnRNPA1A amyloid fibrils in the reference condition of the second regime after 72 h of incubation. TEM analysis of hnRNPA1A fibrils formed in the second regime was conducted with at least three distinct protein preparations. d, FRAP experiments on homotypic (–polyU) and heterotypic (+polyU) condensates after incubation for 30 min and 2 h. After 30 min, condensates both without and with RNA show high fluorescence recovery after photobleaching (±95%). After 2 h, the fluorescence recovery remains constant for heterotypic condensates, while it decreases for homotypic condensates. Protein and polyU concentrations were 20 μM and 100 ng μl–1, respectively (corresponding to the protein/RNA ratio of the second regime). FRAP experiments were performed in technical duplicates with two distinct protein preparations, and for each condition the recovery time after photobleaching was measured from n = 10 different droplets. The graph reports the average of ten measurements, and error bars show the standard deviation. e, Examples of confocal microscopy images of the FRAP experiments, showing the difference in FRAP between homotypic and heterotypic condensates after 2 h of incubation. Source data
Fig. 5
Fig. 5. PolyU promotes hnRNPA1A amyloid formation in the absence of condensation.
a, Re-scan confocal fluorescence microscopy images of hnRNPA1A fibrils after 48 h of incubation with 500 ng μl–1 polyU. This condition was taken as representative of the third regime in Fig. 3. Imaging of fibrils with re-scan microscopy in the third regime was repeated with at least two distinct protein preparations. b, TEM image of hnRNPA1A amyloid fibrils in the third regime after 48 h. TEM analysis was conducted on at least two distinct protein preparations. c, ThT aggregation profiles of hnRNPA1A with 500 mM NaCl (in the absence of protein condensation) in the absence (–) and presence (+) of 500 ng μl–1 polyU. The dashed vertical lines show the half-times (t1/2). The aggregation assays were performed in technical triplicates and with two distinct protein preparations. Source data
Fig. 6
Fig. 6. Concentration-dependent polyU mediation of hnRNPA1A condensation and amyloid formation.
Schematic representation of the three regimes observed with the different RNA concentrations. In the absence of RNA, formation of amyloid fibrils proceeds via condensation, and aggregation is promoted at the interface of the condensates. In the second regime, at low RNA concentration, heterotypic protein–RNA interactions promote condensation and fibril formation, which also in this case are observed at the interface of the condensates. In the third regime, at high RNA concentration, condensation is suppressed, and the formation of amyloid fibrils occurs without condensation. Bright-field and fluorescence microscopy images of the time evolution of amyloid formation are shown in Supplementary Figs. 16–18.
Extended Data Fig. 1
Extended Data Fig. 1. hnRNPA1A amyloid fibrils are oriented parallel to the interface of the condensates.
To further prove the orientation of fibrils at the interface of the condensates, we applied Fluorescence Detected Linear Dichroism (FDLD) in combination with ThT staining to analyse amyloid fibrils formed at later incubation times (24-48 h). From the images, it is possible to observe that ThT molecules bound to horizontally oriented fibrils are preferentially excited by horizontally polarized light (color-coded in blue in the FDLD image, see Material and Methods). In contrast, ThT molecules bound to vertically oriented fibrils are preferentially excited by vertically polarized light (color-coded in yellow in the FDLD image). This experiment was performed in technical duplicates for one single protein batch.
Extended Data Fig. 2
Extended Data Fig. 2. Measurement of monomer conversion using Fluorescence Correlation Spectroscopy (FCS).
Representative auto-correlation curves acquired on atto647N hnRNPA1A after 72h of incubation with (A) 0 ng/ul polyU (B) 50 ng/ul polyU and (C) 500 ng/ul polyU. The curves were fitted with a model assuming a single diffusing component. Data points represent the mean and error bars standard deviation of the measurement. The fitting residuals are showed below each graph. The amplitude decrease of the auto-correlation curve with increasing polyU concentration indicates that RNA contributes to protein solubility. hnRNPA1A concentration calculated in each condition was 1.68 ± 0.51 uM in absence of polyU, 2.5 ± 0.18 uM with 50 ng/ul uM polyU and 4.68 ± 0.20 uM.
Extended Data Fig. 3
Extended Data Fig. 3. Different RNAs modulate re-entrant phase behavior and amyloid formation of hnRNPA1A in a similar manner.
Top row shows bright field microscopy images of hnRNPA1A solutions at 10 uM bulk concentration in presence of 50 or 500 ng/u l of short polyU or specific RNA. For both types of RNA we observe formation of condensates only at the lower concentration, consistent with the re-entrant phase behaviour observed with long polyU. The second and third rows show, respectively, fluorescence microscopy and TEM micrographs of samples after 72 h incubation and demonstrate the presence of amyloid fibrils. The experiments were performed on two independent protein preparations yielding similar results. The secondary structure of the specific RNA was predicted using RNAfold WebServer, (http://rna.tbi.univie.ac.at/cgi-bin/RNAWebSuite/RNAfold.cgi).

Similar articles

Cited by

References

    1. Gebauer, F., Schwarzl, T., Valcárcel, J. & Hentze, M. W. RNA-binding proteins in human genetic disease. Nat. Rev. Genet.22, 185–198 (2021). - PubMed
    1. Harrison, A. F. & Shorter, J. RNA-binding proteins with prion-like domains in health and disease. Biochem. J.474, 1417–1438 (2017). - PMC - PubMed
    1. Neumann, M. et al. Ubiquitinated TDP-43 in frontotemporal lobar degeneration and amyotrophic lateral sclerosis. Science314, 130–133 (2006). - PubMed
    1. Rademakers, R., Neumann, M., Mackenzie, I. R. A. & Rademakers, R. TDP-43 and FUS in amyotrophic lateral sclerosis and frontotemporal dementia. Lancet Neurol.9, 995–1007 (2010). - PubMed
    1. Liu-Yesucevitz L, et al. Tar DNA binding protein-43 (TDP-43) associates with stress granules: analysis of cultured cells and pathological brain tissue. PLoS ONE. 2010;5:e13250. - PMC - PubMed

Publication types

MeSH terms

LinkOut - more resources