. 2024 Mar 12;81(1):128.
doi: 10.1007/s00018-024-05176-5.

Inhibition of EHMT1/2 rescues synaptic damage and motor impairment in a PD mouse model

Affiliations

Inhibition of EHMT1/2 rescues synaptic damage and motor impairment in a PD mouse model

Zhixiong Zhang et al. Cell Mol Life Sci. .

Abstract

Epigenetic dysregulation that leads to alterations in gene expression and is suggested to be one of the key pathophysiological factors of Parkinson's disease (PD). Here, we found that α-synuclein preformed fibrils (PFFs) induced histone H3 dimethylation at lysine 9 (H3K9me2) and increased the euchromatic histone methyltransferases EHMT1 and EHMT2, which were accompanied by neuronal synaptic damage, including loss of synapses and diminished expression levels of synaptic-related proteins. Furthermore, the levels of H3K9me2 at promoters in genes that encode the synaptic-related proteins SNAP25, PSD95, Synapsin 1 and vGLUT1 were increased in primary neurons after PFF treatment, which suggests a linkage between H3K9 dimethylation and synaptic dysfunction. Inhibition of EHMT1/2 with the specific inhibitor A-366 or shRNA suppressed histone methylation and alleviated synaptic damage in primary neurons that were treated with PFFs. In addition, the synaptic damage and motor impairment in mice that were injected with PFFs were repressed by treatment with the EHMT1/2 inhibitor A-366. Thus, our findings reveal the role of histone H3 modification by EHMT1/2 in synaptic damage and motor impairment in a PFF animal model, suggesting the involvement of epigenetic dysregulation in PD pathogenesis.

Keywords: Histone H3 dimethylation; Motor impairment; Parkinson’s disease; Synaptic dysfunction; α-synuclein preformed fibrils.


Conflict of interest statement

The authors declare that they have no conflicts of interest.

Figures
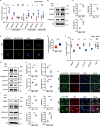
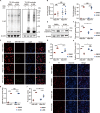
Fig. 1
Fig. 1
PFFs cause increases in H3K9me2 histone methylation and decreases in synapse-associated proteins. (AH) Primary neurons were incubated with 3 µg/mL PFFs at 7 DIV for 14 days and then processed for analysis. A Quantitative real-time PCR data showing the mRNA levels of H3K9, H3K27 and H3K4 methyltransferases in primary neurons treated with PFFs or PBS (n = 3–5). BC Immunoblots and quantitative analysis of EHMT1, EHMT2 and H3K9me2 protein levels in primary neurons (n = 3). D Representative confocal images of H3K9me2 and pSer129 α-syn immunofluorescence staining in primary neurons. Scale bar, 10 μm. E Plots showing the level of H3K9me2 (n = 40). F Quantitative real-time PCR data showing the mRNA levels of PSD95, Synapsin 1, vGLUT1, SNAP25 and Syt1 in primary neurons treated with PFFs or PBS (n = 3–6). GH Immunoblots and quantitative analyses of PSD95, Synapsin 1, vGLUT1 and SNAP25 protein levels in primary neurons (n = 3). (IK) PFFs were transfected into HEK293-α-syn-GFP cells at 3 µg/mL for 72 h and then processed for analysis. IJ Immunoblots and quantitative analysis of EHMT1, EHMT2, H3K9me2 and H3K9me3 protein levels in the HEK293-α-syn-GFP stable cell line treated with PFFs or PBS (n = 3). K Representative images of immunofluorescence staining of pSer129 α-syn, p62 and α-syn-GFP in HEK293-α-syn-GFP cells. Scale bar, 10 μm. The P values were calculated using an unpaired t test in A, C, E, F, H and J. *P < 0.05, **P < 0.01, ***P < 0.001, ****P < 0.0001, NS indicates not significant. The data are represented as the mean ± SEM
Fig. 2
Fig. 2
Inhibition of EHMT1/2 rescues the decline in synapse-related proteins by reducing the level of H3K9me2. (AC) Primary neurons were incubated with 3 µg/mL PFFs at 7 DIV for 14 days and then processed for analysis. Treatment with A-366 was administered according to the schematic diagram depicted in Supple Fig. 3C. A Quantitative real-time PCR data showing the mRNA levels of SNAP25, Syt2, PSD95, Synapsin 1, vGLUT1, Syntaxin1A, Syt1, Synagr3, Synaptophysin and VMAT2 in primary neurons (n = 3–5). BC Immunoblots and quantitative analysis of PSD95, Synapsin 1, vGLUT1, SNAP25 and H3K9me2 (n = 3). DE Immunoblots and quantitative analysis of EHMT1, EHMT2, H3K9me2, PSD95, Synapsin 1, vGLUT1, and SNAP25 in primary neurons treated with PFFs, or PBS and scr. shRNA or EHMT1/2 (1) shRNA (n = 3). shRNAs were added to primary neurons at 5 DIV. Subsequently, PFFs were added to primary neurons at 7 DIV for 14 days. The P values were calculated using two-way ANOVA in A, C and E. *P < 0.05, **P < 0.01, ***P < 0.001, NS indicates not significant. Data are represented as the mean ± SEM
Fig. 3
Fig. 3
H3K9me2 methylation at gene promoters in primary neurons treated with PFFs or PBS or A-366 or DMSO. Primary neurons were incubated with 3 µg/mL PFFs at 7 DIV for 14 days and then processed for analysis. Treatment with A-366 was administered according to the schematic diagram depicted in Supple Fig. 3C. A PCR images showing the input (total DNA) and ChIP (H3K9me2-occupied DNA) signals at the upstream transcription start site regions of SNAP25, PSD95, vGLUT1 and Synapsin 1. Mouse IgG was used as the negative control. B ChIP assay data showing the enrichment of H3K9me2 at the SNAP25, PSD95, vGLUT1 and Synapsin 1 promoter regions. (n = 3). C ChIP‒qPCR data comparing the enrichment of H3K9me2 at SNAP25, PSD95, vGLUT1 and Synapsin 1 in neurons treated with PFFs or PBS and A-366 or DMSO. Mouse IgG was used as the negative control. (n = 4). The P values were calculated using two-way ANOVA in B and C. *P < 0.05, **P < 0.01, ****P < 0.0001. The data are represented as the mean ± SEM
Fig. 4
Fig. 4
The EHMT1/2 inhibitor A-366 rescues the death of neurons without affecting the formation of α-syn oligomers. Primary neurons were incubated with 3 µg/mL PFFs at 7 DIV for 14 days and then processed for analysis. Treatment with A-366 was administered according to the schematic diagram depicted in Supple Fig. 3C. AB Immunoblots and quantitative analysis of Triton X-100-soluble and Triton X-100-insoluble α-syn in primary neurons treated with PFFs, PBS, A-366 or DMSO (n = 3). C Representative confocal images of immunofluorescence staining for NeuN and pSer129 α-syn in primary neurons. Scale bar, 20 μm. D Plots showing the level of pSer129 α-syn (n = 3). EF Immunoblots and quantitative analysis of cleaved caspase 3 in primary neurons treated with PFFs or PBS and A-366 or DMSO (n = 3). G Culture media from primary neurons treated with PFFs or PBS and A-366 or DMSO were collected to detect LDH release (n = 3–5). H The viability of primary neurons treated with PFFs, PBS, and A-366 or DMSO was measured via the CCK8 assay (n = 3). I Representative images of Hoechst and PI staining of primary neurons treated with PFFs or PBS and A-366 or DMSO. Scale bar, 50 μm. J Plots showing the percentage of PI-positive cells (n = 3). The P values were calculated using two-way ANOVA in B, D, F, G, H and J. *P < 0.05, ***P < 0.001, ****P < 0.0001, NS indicates not significant. The data are represented as the mean ± SEM
Fig. 5
Fig. 5
The EHMT1/2 inhibitor A-366 rescues morphological damage and the loss of synaptic numbers in neurons. Primary neurons were incubated with 3 µg/mL PFFs at 7 DIV for 14 days and then processed for analysis. Treatment with A-366 was administered according to the schematic diagram depicted in Supple Fig. 3C. A Representative confocal images of immunofluorescence staining for MAP2 and pSer129 α-syn in primary neurons treated with PFFs, PBS, A-366 or DMSO. Scale bar, 20 μm. B Diagram of branch intersections in the circular grid and quantification of intersections by Sholl analysis in each group (n = 30). C Representative transmission electron microscopy (TEM) images showing the ultrastructure of synapses of primary neurons treated with PFFs or PBS and A-366 or DMSO. Scale bar, 200 nm. D Quantification of the thickness of the postsynaptic density (PSD) in each group (n = 30). E Representative confocal images of immunofluorescence staining for PSD95 and Synapsin 1 in primary neurons treated with PFFs or PBS and A-366 or DMSO. Scale bar, 5 μm. F Quantification of the colocalization of Synapsin 1 with PSD95 in dendritic segments (n = 30). The P values were calculated using two-way ANOVA in B, D and F. *P < 0.05, **P < 0.01, ***P < 0.001, ****P < 0.0001. The data are represented as the mean ± SEM
Fig. 6
Fig. 6
EHMT1/2 inhibition rescues motor deficits in PFF model mice. A Scheme the stereotactic injection of PFF and timeline of the A-366 administration. Mice were anesthetized and stereotaxically injected bilaterally into the striatum region with PFFs (2.5 μg/side); PBS was used as a control. B Representative images of immunofluorescence staining of TH and pSer129 α-syn within the SNpc and striatum in mice treated with PFFs or PBS. Scale bar, 100 μm. (CG) Mice were injected with 5 µg of PFFs. Treatment with A-366 was administered according to the schematic diagram depicted in Fig. 6A. CE Behavioral assessment at 6 months after PFF injection. The results for the mice in the C wire hang test, D rotarod test, and E pole test are shown (n = 10–12/group). F Representative movement paths of mice from each group in the open field test. G The distances traveled by mice treated with PFFs or PBS and A-366 or saline are shown (n = 10/group). The P values were calculated using two-way ANOVA in C, D, E and G. *P < 0.05, **P < 0.01, ****P < 0.0001. The data are represented as the mean ± SEM
Fig. 7
Fig. 7
The EHMT1/2 inhibitor A-366 rescues the loss of dopamine neurons by reducing the level of H3K9me2 in PFF model mice. Mice were injected with 5 µg of PFFs. Treatment with A-366 was administered according to the schematic diagram depicted in Fig. 6A. A Representative images of immunofluorescence staining of TH and pSer129 α-syn within the SNpc. Scale bar, 100 μm. B Quantification of TH-positive neurons within the SNpc (n = 6/group). C Representative images of immunofluorescence staining of TH and pSer129 α-syn within the striatum. Scale bar, 25 μm. D Quantification of the fluorescence intensity of TH-positive cells in the striatum (n = 6/group). E Representative images for immunofluorescence staining of TH and H3K9me2 within the substantia nigra. Scale bar, 50 μm. F Quantification of the fluorescence intensity of H3K9me2 in the substantia nigra (n = 8–12/group). The P values were calculated using two-way ANOVA in B, D and F. *P < 0.05, **P < 0.01, ***P < 0.001, ****P < 0.0001. The data are represented as the mean ± SEM
Fig. 8
Fig. 8
The EHMT1/2 inhibitor A-366 rescues the decrease in synapse-related proteins by reducing the level of H3K9me2 in PFF model mice. Mice were injected with 5 µg of PFFs. Treatment with A-366 was administered according to the schematic diagram depicted in Fig. 6A. AB Immunoblots and quantitative analysis of PSD95, Synapsin 1, vGLUT1, SNAP25 and TH in the striatal tissue of mice treated with PFFs, PBS, A-366 or saline (n = 3). CD Immunoblots and quantitative analysis of EHMT1, EHMT2, H3K9me2 and TH from midbrain tissue of mice (n = 3). E Quantitative real-time RT‒PCR data showing the mRNA levels of PSD95, Synapsin 1, vGLUT1, SNAP25, EHMT1 and EHMT2 in the midbrain tissue of mice (n = 3). F Representative images of Golgi staining of neurons within the substantia nigra in mice treated with PFFs or PBS and A-366 or saline. Scale bar, 10 μm. G Quantification of neuronal dendritic spines in the substantia nigra (n = 30/group). The P values were calculated using two-way ANOVA in B, D, E and G. *P < 0.05, **P < 0.01, ***P < 0.001, ****P < 0.0001, NS indicates not significant. The data are represented as the mean ± SEM
Fig. 9
Fig. 9
A schematic model showing the epigenetic mechanism of PD. PFFs induce the accumulation of α-syn oligomers and lead to the increased H3K9me2 repressive histone methylation at the promoter regions of SNAP25, PSD95, Synapsin 1, and vGLUT1, causing decreased transcription of these genes (left side). Consequently, synaptic damage, DA neuron loss and motor impairment occur in PD mice. Inhibiting EHMT1/2 with the inhibitor A-366 or shRNA reversed the aberrant epigenetic regulation of synapses in PD models, restoring synaptic function and motility (right side)

Similar articles

Cited by

References

    1. Poewe W, Seppi K, Tanner CM, Halliday GM, Brundin P, Volkmann J, Schrag A-E, Lang AE. Parkinson disease. Nat Rev Dis Primers. 2017;3:17013. doi: 10.1038/nrdp.2017.13. - DOI - PubMed
    1. Shults CW. Lewy bodies. Proc Natl Acad Sci U S A. 2006;103(6):1661–1668. doi: 10.1073/pnas.0509567103. - DOI - PMC - PubMed
    1. Shahmoradian SH, Lewis AJ, Genoud C, Hench J, Moors TE, Navarro PP, Castaño-Díez D, Schweighauser G, Graff-Meyer A, Goldie KN, et al. Lewy pathology in Parkinson's disease consists of crowded organelles and lipid membranes. Nat Neurosci. 2019;22(7):1099–1109. doi: 10.1038/s41593-019-0423-2. - DOI - PubMed
    1. Bonifati V, Rizzu P, van Baren MJ, Schaap O, Breedveld GJ, Krieger E, Dekker MCJ, Squitieri F, Ibanez P, Joosse M, et al. Mutations in the DJ-1 gene associated with autosomal recessive early-onset parkinsonism. Science. 2003;299(5604):256–259. doi: 10.1126/science.1077209. - DOI - PubMed
    1. Gan-Or Z, Giladi N, Rozovski U, Shifrin C, Rosner S, Gurevich T, Bar-Shira A, Orr-Urtreger A. Genotype-phenotype correlations between GBA mutations and Parkinson disease risk and onset. Neurology. 2008;70(24):2277–2283. doi: 10.1212/01.wnl.0000304039.11891.29. - DOI - PubMed