. 2024 Apr;25(2):149-165.
doi: 10.1007/s10162-024-00938-1. Epub 2024 Mar 12.

A Low Dose of Rapamycin Promotes Hair Cell Differentiation by Enriching SOX2+ Progenitors in the Neonatal Mouse Inner Ear Organoids

Affiliations

A Low Dose of Rapamycin Promotes Hair Cell Differentiation by Enriching SOX2+ Progenitors in the Neonatal Mouse Inner Ear Organoids

Wenjin Wu et al. J Assoc Res Otolaryngol. 2024 Apr.

Abstract

Purpose: To investigate the impact of rapamycin on the differentiation of hair cells.

Methods: Murine cochlear organoids were derived from cochlear progenitor cells. Different concentrations of rapamycin were added into the culture medium at different proliferation and differentiation stages.

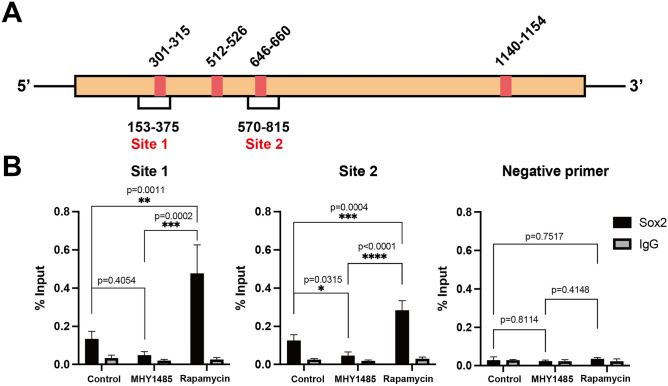
Results: Rapamycin exhibited a concentration-dependent reduction in the proliferation of these inner ear organoids. Nevertheless, organoids subjected to a 10-nM dose of rapamycin demonstrated a markedly increased proportion of hair cells. Furthermore, rapamycin significantly upregulated the expression of markers associated with both hair cells and supporting cells, including ATOH1, MYO7A, and SOX2. Mechanistic studies revealed that rapamycin preferentially suppressed cells without Sox2 expression during the initial proliferation stage, thereby augmenting and refining the population of SOX2+ progenitors. These enriched progenitors were predisposed to differentiate into hair cells during the later stages of organoid development. Conversely, the use of the mTOR activator MHY 1485 demonstrated opposing effects.

Conclusion: Our findings underscore a practical strategy for enhancing the generation of inner ear organoids with a low dose of rapamycin, achieved by enriching SOX2+ progenitors in an in vitro setting.

Keywords: Hair cell; Inner ear; Organoids; Rapamycin; Regeneration.


Conflict of interest statement

The authors declare no competing interests.

Figures

Fig. 1
Fig. 1
Rapamycin downregulates the formation of the organoid but preserves the SOX2+ clusters. Organoid cultures were established from cochlear epithelial cells obtained from Atoh1-nGFP transgenic mice, stage P3. A Experimental design for the control and treatment groups. Rapamycin was added into the culture medium from the beginning of the proliferation stage. Organoids were collected at P5 (proliferation day 5). B Brightfield images of organoid cultures with rapamycin treatment at different concentrations throughout 5 days of proliferation. C Organoid forming efficiency in the control group and treatment groups (n = 3 independent experiments, individual data points represent the average value per well of organoid culture). D Organoid diameters in the control group and treatment groups (n = 8, four independent experiments with two wells of organoids each). E Cell proliferation ability in the control group and treatment group with 10 nM rapamycin. A single EdU pulse was given at 5 days of proliferation and EdU incorporation (white) was analyzed 1 h later. SOX2 (red) marks supporting cells/prosensory cells and Hoechst (blue) label cell nuclei. F Percentage of EdU+ cells in the control and rapamycin-treated organoids in E (n = 6, three independent experiments with two organoids each). G Percentage of SOX2+EdU+ cells out of EdU+ cells in the control and rapamycin-treated organoids in E (n = 6, three independent experiments with two organoids each). H Flow cytometry analysis of cells collected at P5 organoids. Graphic representation of cell proliferation expressed as a percent of EdU (Alexa Fluor 488) and SOX2PE-positive cells. Cells were collected from control organoids and drug-treated organoids (rapamycin 10 nM or MHY 1485 1 μM added). I Percentage of EdU+ and SOX2+EdU+ cells from the cytometry analyses in H. Each bar represents the mean ± standard deviation of the percentage of positive cells in the organoids (n = 3 independent experiments). Graphed are individual data points and mean ± SD. Two-tailed, unpaired Student’s t tests were used to calculate P values between two groups. One-way ANOVA was used to calculate P values between multiple groups
Fig. 2
Fig. 2
Low-dose rapamycin treatment enhances the ratio of hair cell formation in cochlear organoid culture. Organoid cultures were established from stage P3 Atoh1-nGFP transgenic mice. Atoh1-nGFP marks nascent hair cells. A Experimental strategy for cell collection. Rapamycin was added into the culture medium through the proliferation and differentiation stages. Organoids were collected at D4 (differentiation day 4). B Brightfield and green fluorescent (Atoh1-nGFP) images of control and rapamycin-treated organoids after 4 days of differentiation. C Percentage of Atoh1-nGFP+ organoids after 4 days of differentiation in control and rapamycin-treated cultures at different concentrations (n = 6, three independent experiments). D Hair cell-specific mRNA expression (Atoh1, Myo7a) and supporting cell marker expression (Sox2) by qRT-PCR in control and rapamycin-treated organoids after 4 days of differentiation (n = 3 independent experiments). E Confocal images of organoid cultures with different treatments after 4 days of differentiation. Newly formed hair cells express Atoh1-nGFP and MYO7a. F Percentage of Atoh1-nGFP+ and MYO7A+ cells per organoid in E (n = 3 independent experiments). G Flow cytometry analysis of cells collected at D4 organoids. Graphic representation of hair cells expressed as a percent of ATOH1- and MYO7A-positive cells. Cells were collected from control organoids and drug-treated organoids (rapamycin 10 nM or MHY 1485 1 μM added). H Percentage of ATOH1+ and MYO7A+ cells from the cytometry analyses in G. Each bar represents the mean ± standard deviation of the percentage of positive cells in the organoids (n = 3 independent experiments). Bars in C and D represent mean ± SD. One-way ANOVA with Dunnett’s correction was used to calculate P values. Differences were considered statistically significant at *P < 0.05, **P < 0.01, ***P < 0.001, and ****P < 0.0001
Fig. 3
Fig. 3
Rapamycin modulates hair cell production primarily during the early proliferation stage. Organoid cultures were established from stage P3 Atoh1-nGFP transgenic mice. A Schematic diagram of proliferation and differentiation protocol using 10 nM rapamycin. Organoid was treated with rapamycin at different stages. B Hair cell–specific mRNA expression (Atoh1, Myo7a) by qRT-PCR in control and rapamycin-treated organoids after 4 days of differentiation (n = 3 independent experiments). Bars in B represent mean ± SD. One-way ANOVA with Tukey’s correction was used to calculate P values. Differences were considered statistically significant at *P < 0.05 and **P < 0.01
Fig. 4
Fig. 4
Inhibition of SOX2+ cluster ratio and downregulation of hair cell differentiation by mTOR activation. Organoid cultures were established from cochlear epithelia cells obtained from Atoh1-nGFP transgenic mice, stages P3. A Experimental strategy. MHY1485 was added into the culture medium through the proliferation and differentiation stage. Organoids were analyzed at P8 (proliferation day 8) and D4 (differentiation day 4) respectively. B Brightfield images of control and MHY1485- (1 μM) treated organoids throughout 8 days of proliferation. C Organoid forming efficiency in the control group and treatment groups (n = 3 independent experiments). D Organoid diameters in the control group and treatment groups (n = 8, four independent experiments with two wells of organoids each). E Cell proliferation ability in the control group and treatment group with 1 μM MHY1485. A single EdU pulse was given at 8 days of proliferation and EdU incorporation (white) was analyzed 1 h later. SOX2 (red) marks supporting cells/prosensory cells and Hoechst (blue) labels cell nuclei. F Percentage of EdU+ cells in the control and MHY1485-treated organoids in E (n = 6, three independent experiments with two organoids each). G Percentage of SOX2+ EdU+ cells out of EdU+ cells in the control and MHY1485-treated organoids in E (n = 6, three independent experiments with two organoids each). H Brightfield and green fluorescent (Atoh1-nGFP) images of control and MHY1485-treated organoids after 4 days of differentiation. I Percentage of Atoh1-nGFP+ organoids after 4 days of differentiation in control and MHY1485-treated cultures (n = 6, three independent experiments). Graphed are individual data points and mean ± SD. Two-tailed, unpaired Student’s t tests were used to calculate P values
Fig. 5
Fig. 5
mTOR activator MHY1485 downregulates hair cell production primarily during the early proliferation stage. Organoid cultures were established from stage P3 Atoh1-nGFP transgenic mice. A Hair cell–specific mRNA expression (Atoh1, Myo7a) and supporting cell marker expression (Sox2) by qRT-PCR in control and MHY1485-treated organoids at different concentrations after 4 days of differentiation (n = 3 independent experiments). B Schematic diagram of proliferation and differentiation protocol using MHY1485. Organoid was treated with 1 μM MHY1485 at different stages. The blue column referred to the proliferation stage and the pink column referred to the differentiation stage. C Hair cell-specific mRNA expression (Atoh1, Myo7a) by qRT-PCR in control and MHY1485-treated organoids after 4 days of differentiation (n = 3 independent experiments). Bars in A and C represent mean ± SD. One-way ANOVA with Tukey’s correction was used to calculate P values. Differences were considered statistically significant at *P < 0.05, **P < 0.01, and ***P < 0.001
Fig. 6
Fig. 6
Influence of rapamycin and MHY1485 on the activation of the Atoh1 enhancer through SOX2 binding. A The SOX2 binding sites in Atoh1 3′-enhancer are identified by MatInspector (Genomatix) and shown in red boxes. The binding sites (site 1 and site 2) covered by the selected primers are also shown in the figure. B MHY1485 or rapamycin was added to the whole process of inner ear organoids culture. Quantitative ChIP was performed in organoids after 10 days of cell proliferation and 4 days of differentiation. DNA was precipitated with SOX2 antibody or normal goat IgG, followed by RT-PCR with site 1 and site 2. A negative primer was used as control. ChIP for SOX2 was compared to ChIP for normal goat IgG. Compared with the control group, ChIP with SOX2 antibody showed increased binding with rapamycin treatment and decreased binding with MHY1485 treatment at both sites covering the active binding site of SOX2 to Atoh1 (*P < 0.05; **P < 0.01). One-way ANOVA with Tukey’s correction was used to calculate P values

Similar articles

Cited by

References

    1. Shahab M, Rosati R, Meyer DN, Shields JN, Crofts E, Baker TR, Jamesdaniel S. Cisplatin-induced hair cell loss in zebrafish neuromasts is accompanied by protein nitration and Lmo4 degradation. Toxicol Appl Pharmacol. 2021;410:115342. doi: 10.1016/j.taap.2020.115342. - DOI - PMC - PubMed
    1. Ding D, Allman BL, Salvi R. Review: ototoxic characteristics of platinum antitumor drugs. Anat Rec (Hoboken) 2012;295:1851–1867. doi: 10.1002/ar.22577. - DOI - PubMed
    1. Rubel EW, Furrer SA, Stone JS. A brief history of hair cell regeneration research and speculations on the future. Hear Res. 2013;297:42–51. doi: 10.1016/j.heares.2012.12.014. - DOI - PMC - PubMed
    1. Corwin JT. Postembryonic production and aging in inner ear hair cells in sharks. J Comp Neurol. 1981;201:541–553. doi: 10.1002/cne.902010406. - DOI - PubMed
    1. Corwin JT, Cotanche DA. Regeneration of sensory hair cells after acoustic trauma. Science. 1988;240:1772–1774. doi: 10.1126/science.3381100. - DOI - PubMed

LinkOut - more resources