

On the Dependence of the Critical Success Index (CSI) on Prevalence
- PMID: 38473017
- PMCID: PMC10931251
- DOI: 10.3390/diagnostics14050545
On the Dependence of the Critical Success Index (CSI) on Prevalence
Abstract
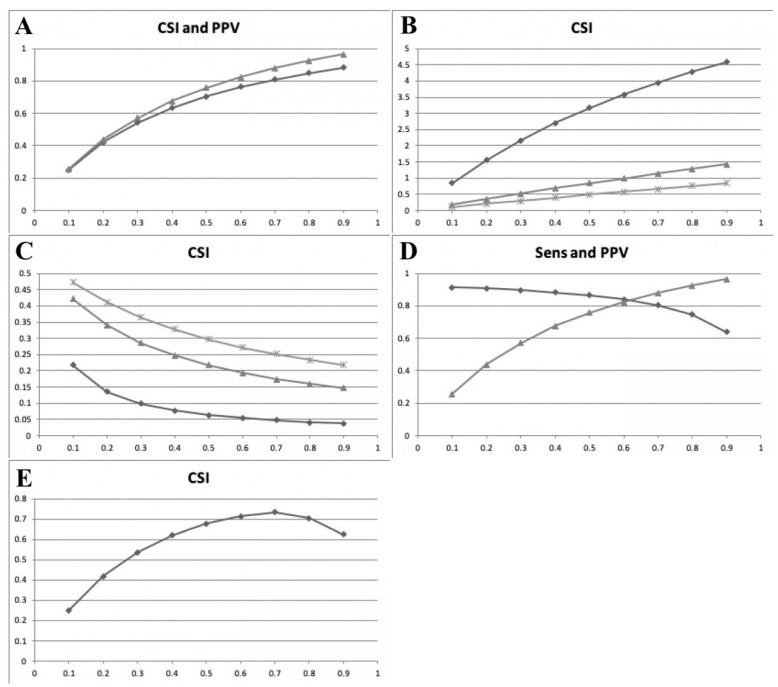
The critical success index (CSI) is an established metric used in meteorology to verify the accuracy of weather forecasts. It is defined as the ratio of hits to the sum of hits, false alarms, and misses. Translationally, CSI has gained popularity as a unitary outcome measure in various clinical situations where large numbers of true negatives may influence the interpretation of other, more traditional, outcome measures, such as specificity (Spec) and negative predictive value (NPV), or when unified interpretation of positive predictive value (PPV) and sensitivity (Sens) is needed. The derivation of CSI from measures including PPV has prompted questions as to whether and how CSI values may vary with disease prevalence (P), just as PPV estimates are dependent on P, and hence whether CSI values are generalizable between studies with differing prevalences. As no detailed study of the relation of CSI to prevalence has been undertaken hitherto, the dataset of a previously published test accuracy study of a cognitive screening instrument was interrogated to address this question. Three different methods were used to examine the change in CSI across a range of prevalences, using both the Bayes formula and equations directly relating CSI to Sens, PPV, P, and the test threshold (Q). These approaches showed that, as expected, CSI does vary with prevalence, but the dependence differs according to the method of calculation that is adopted. Bayesian rescaling of both Sens and PPV generates a concave curve, suggesting that CSI will be maximal at a particular prevalence, which may vary according to the particular dataset.
Keywords: Bayes formula; F measure; binary classification; critical success index; prevalence.
Conflict of interest statement
The authors declare no conflicts of interest.
Figures
References
-
- Larner A.J. The 2 × 2 Matrix: Contingency, Confusion and the Metrics of Binary Classification. 2nd ed. Springer; London, UK: 2024.
Grants and funding
LinkOut - more resources
Full Text Sources
