Quantitative CT Texture Analysis of COVID-19 Hospitalized Patients during 3-24-Month Follow-Up and Correlation with Functional Parameters
- PMID: 38473022
- PMCID: PMC10931356
- DOI: 10.3390/diagnostics14050550
Quantitative CT Texture Analysis of COVID-19 Hospitalized Patients during 3-24-Month Follow-Up and Correlation with Functional Parameters
Abstract
Background: To quantitatively evaluate CT lung abnormalities in COVID-19 survivors from the acute phase to 24-month follow-up. Quantitative CT features as predictors of abnormalities' persistence were investigated.
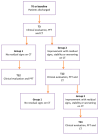
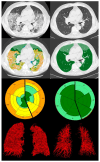
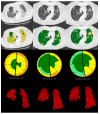
Methods: Patients who survived COVID-19 were retrospectively enrolled and underwent a chest CT at baseline (T0) and 3 months (T3) after discharge, with pulmonary function tests (PFTs). Patients with residual CT abnormalities repeated the CT at 12 (T12) and 24 (T24) months after discharge. A machine-learning-based software, CALIPER, calculated the CT percentage of the whole lung of normal parenchyma, ground glass (GG), reticulation (Ret), and vascular-related structures (VRSs). Differences (Δ) were calculated between time points. Receiver operating characteristic (ROC) curve analyses were performed to test the baseline parameters as predictors of functional impairment at T3 and of the persistence of CT abnormalities at T12.
Results: The cohort included 128 patients at T0, 133 at T3, 61 at T12, and 34 at T24. The GG medians were 8.44%, 0.14%, 0.13% and 0.12% at T0, T3, T12 and T24. The Ret medians were 2.79% at T0 and 0.14% at the following time points. All Δ significantly differed from 0, except between T12 and T24. The GG and VRSs at T0 achieved AUCs of 0.73 as predictors of functional impairment, and area under the curves (AUCs) of 0.71 and 0.72 for the persistence of CT abnormalities at T12.
Conclusions: CALIPER accurately quantified the CT changes up to the 24-month follow-up. Resolution mostly occurred at T3, and Ret persisting at T12 was almost unchanged at T24. The baseline parameters were good predictors of functional impairment at T3 and of abnormalities' persistence at T12.
Keywords: COVID-19 pneumonia; CT; follow-up; lung; machine learning; quantitative computed tomography; texture analysis.
Conflict of interest statement
Brian J. artholmai declares personal fees from Promedior, LLC, and from Imbio, LLC, outside the submitted work. The Mayo Clinic has received grants from NIH/NHLBI, fees from Imbio, LLC, and Boehringer Ingelheim outside the submitted work. In addition, Dr. Bartholmai has a patent for SYSTEMS AND METHODS FOR ANALYZING IN VIVO TISSUE VOLUMES USING MEDICAL IMAGING pending to the Mayo Clinic. These systems and methods were not utilized in this study. The other authors of this manuscript declare no conflicts of interest.
Figures


References
-
- Gorbalenya A.E., Baker S.C., Baric R.S., De Groot R.J., Drosten C., Gulyaeva A.A., Haagmans B.L., Lauber C., Leontovich A., Neuman B.W., et al. The species Severe acute respiratory syndrome-related coronavirus: Classifying 2019-nCoV and naming it SARS-CoV-2. Nat. Microbiol. 2020;5:536–544. - PMC - PubMed
LinkOut - more resources
Full Text Sources

