

Modeling the Effect of Spatial Structure on Solid Tumor Evolution and Circulating Tumor DNA Composition
- PMID: 38473206
- PMCID: PMC10930890
- DOI: 10.3390/cancers16050844
Modeling the Effect of Spatial Structure on Solid Tumor Evolution and Circulating Tumor DNA Composition
Abstract
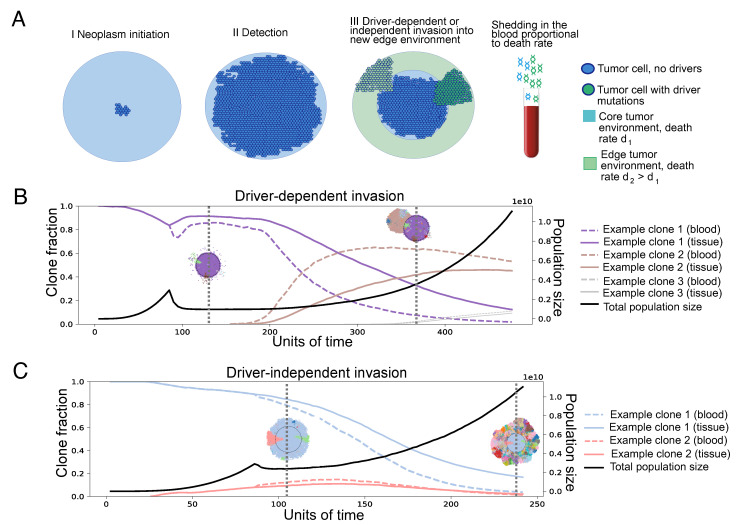
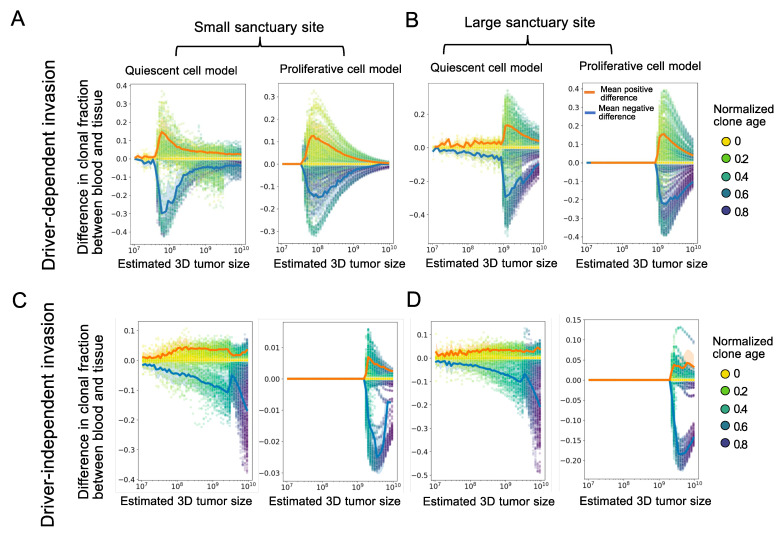
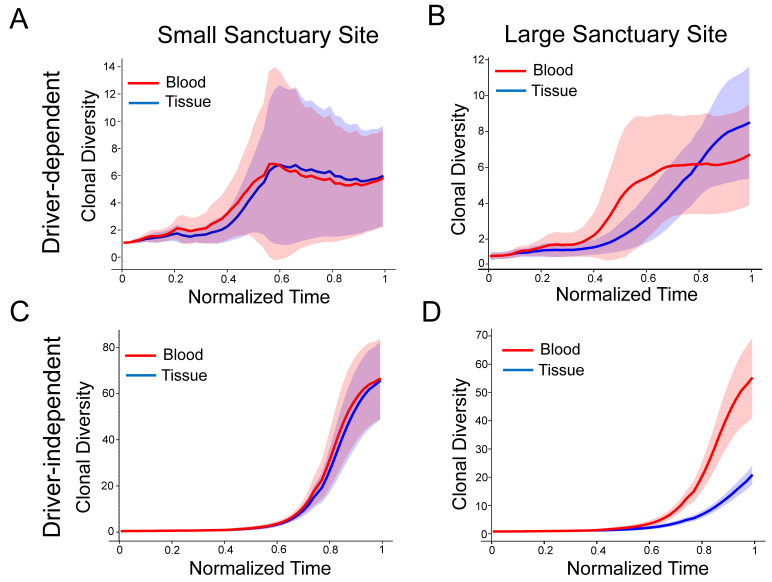
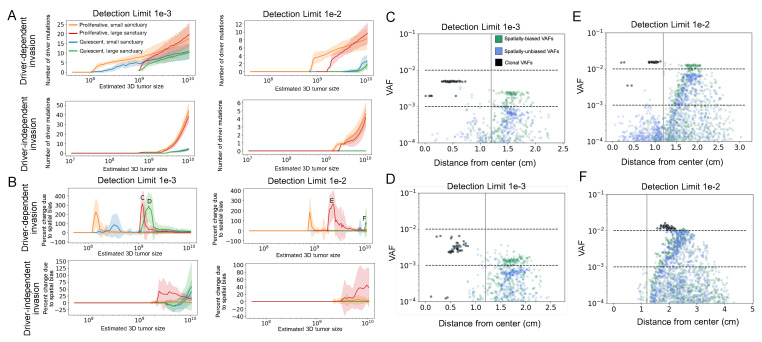
Circulating tumor DNA (ctDNA) monitoring, while sufficiently advanced to reflect tumor evolution in real time and inform cancer diagnosis, treatment, and prognosis, mainly relies on DNA that originates from cell death via apoptosis or necrosis. In solid tumors, chemotherapy and immune infiltration can induce spatially variable rates of cell death, with the potential to bias and distort the clonal composition of ctDNA. Using a stochastic evolutionary model of boundary-driven growth, we study how elevated cell death on the edge of a tumor can simultaneously impact driver mutation accumulation and the representation of tumor clones and mutation detectability in ctDNA. We describe conditions in which invasive clones are over-represented in ctDNA, clonal diversity can appear elevated in the blood, and spatial bias in shedding can inflate subclonal variant allele frequencies (VAFs). Additionally, we find that tumors that are mostly quiescent can display similar biases but are far less detectable, and the extent of perceptible spatial bias strongly depends on sequence detection limits. Overall, we show that spatially structured shedding might cause liquid biopsies to provide highly biased profiles of tumor state. While this may enable more sensitive detection of expanding clones, it could also increase the risk of targeting a subclonal variant for treatment. Our results indicate that the effects and clinical consequences of spatially variable cell death on ctDNA composition present an important area for future work.
Keywords: ctDNA; spatial evolution; tumor DNA shedding; tumor evolution; tumor growth model.
Conflict of interest statement
The authors declare no conflicts of interest. The funders had no role in the design of the study; in the collection, analyses, or interpretation of data; in the writing of the manuscript; or in the decision to publish the results.
Figures
Update of
-
Modeling the effect of spatial structure on solid tumor evolution and ctDNA composition.bioRxiv [Preprint]. 2023 Nov 11:2023.11.10.566658. doi: 10.1101/2023.11.10.566658. bioRxiv. 2023. Update in: Cancers (Basel). 2024 Feb 20;16(5):844. doi: 10.3390/cancers16050844. PMID: 37986965 Free PMC article. Updated. Preprint.
Similar articles
-
Modeling the effect of spatial structure on solid tumor evolution and ctDNA composition.bioRxiv [Preprint]. 2023 Nov 11:2023.11.10.566658. doi: 10.1101/2023.11.10.566658. bioRxiv. 2023. Update in: Cancers (Basel). 2024 Feb 20;16(5):844. doi: 10.3390/cancers16050844. PMID: 37986965 Free PMC article. Updated. Preprint.
-
Clonal dynamics of circulating tumor DNA during immune checkpoint blockade therapy for melanoma.Cancer Sci. 2021 Nov;112(11):4748-4757. doi: 10.1111/cas.15088. Epub 2021 Sep 22. Cancer Sci. 2021. PMID: 34477284 Free PMC article.
-
Modeling clonal structure over narrow time frames via circulating tumor DNA in metastatic breast cancer.Genome Med. 2021 May 20;13(1):89. doi: 10.1186/s13073-021-00895-x. Genome Med. 2021. PMID: 34016182 Free PMC article.
-
Dynamic Treatment Stratification Using ctDNA.Recent Results Cancer Res. 2020;215:263-273. doi: 10.1007/978-3-030-26439-0_14. Recent Results Cancer Res. 2020. PMID: 31605234 Review.
-
Clinical Utility of Analyzing Circulating Tumor DNA in Patients with Metastatic Colorectal Cancer.Oncologist. 2018 Nov;23(11):1310-1318. doi: 10.1634/theoncologist.2017-0621. Epub 2018 Apr 26. Oncologist. 2018. PMID: 29700206 Free PMC article. Review.
Cited by
-
Early ctDNA kinetics as a dynamic biomarker of cancer treatment response.bioRxiv [Preprint]. 2024 Jul 3:2024.07.01.601508. doi: 10.1101/2024.07.01.601508. bioRxiv. 2024. Update in: JCO Clin Cancer Inform. 2025 Mar;9:e2400160. doi: 10.1200/CCI-24-00160. PMID: 39005329 Free PMC article. Updated. Preprint.
-
Early Circulating Tumor DNA Kinetics as a Dynamic Biomarker of Cancer Treatment Response.JCO Clin Cancer Inform. 2025 Mar;9:e2400160. doi: 10.1200/CCI-24-00160. Epub 2025 Mar 7. JCO Clin Cancer Inform. 2025. PMID: 40053881 Free PMC article.
-
A perspective review on the systematic implementation of ctDNA in phase I clinical trial drug development.J Exp Clin Cancer Res. 2025 Mar 1;44(1):79. doi: 10.1186/s13046-025-03328-4. J Exp Clin Cancer Res. 2025. PMID: 40022112 Free PMC article. Review.
References
Grants and funding
LinkOut - more resources
Full Text Sources
