. 2024 Feb 20;16(5):846.
doi: 10.3390/cancers16050846.

Molecular, Metabolic, and Subcellular Mapping of the Tumor Immune Microenvironment via 3D Targeted and Non-Targeted Multiplex Multi-Omics Analyses

Affiliations

Molecular, Metabolic, and Subcellular Mapping of the Tumor Immune Microenvironment via 3D Targeted and Non-Targeted Multiplex Multi-Omics Analyses

Sammy Ferri-Borgogno et al. Cancers (Basel). .

Abstract

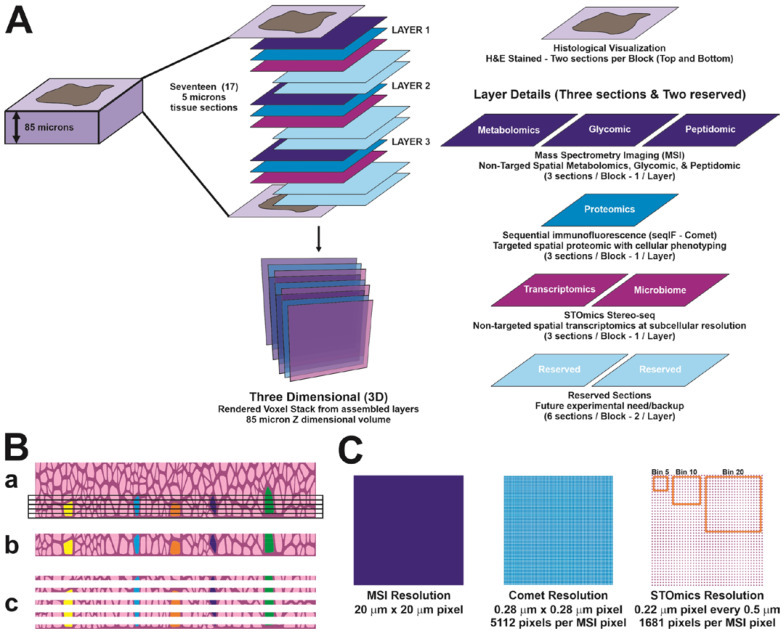
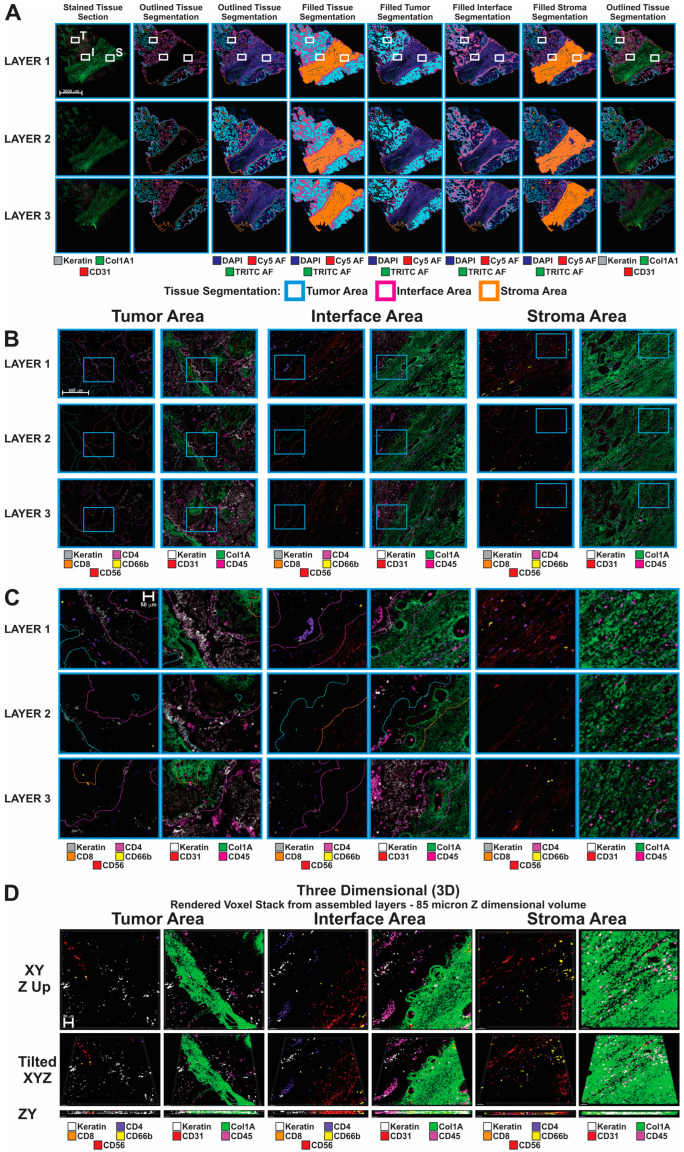
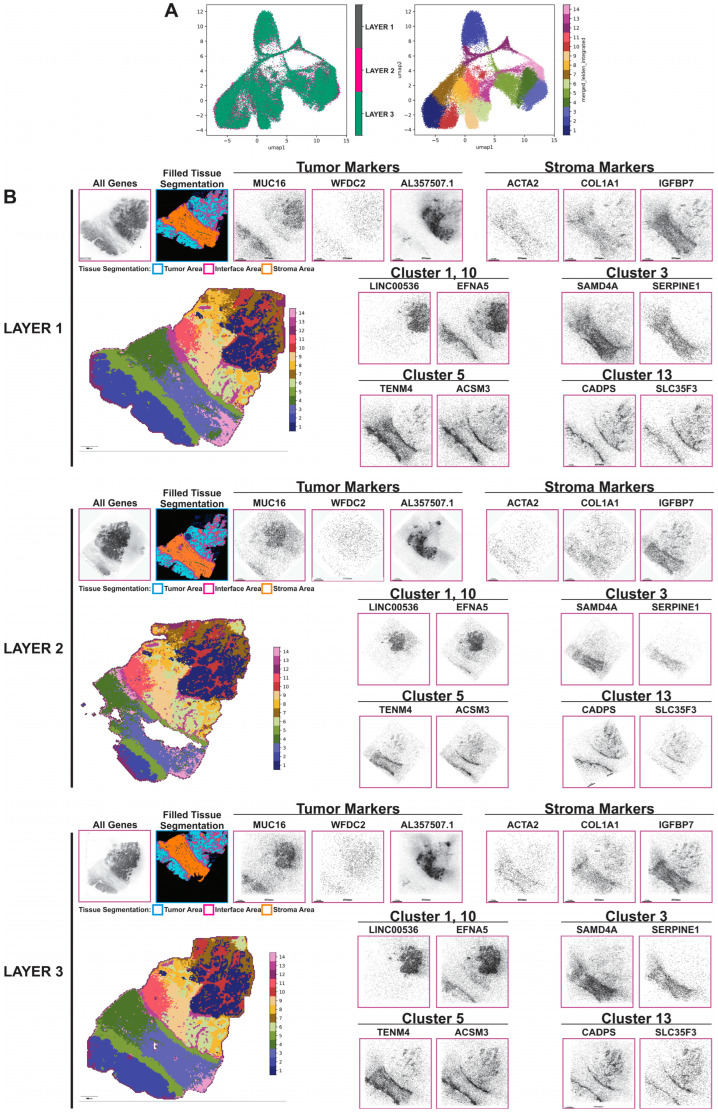
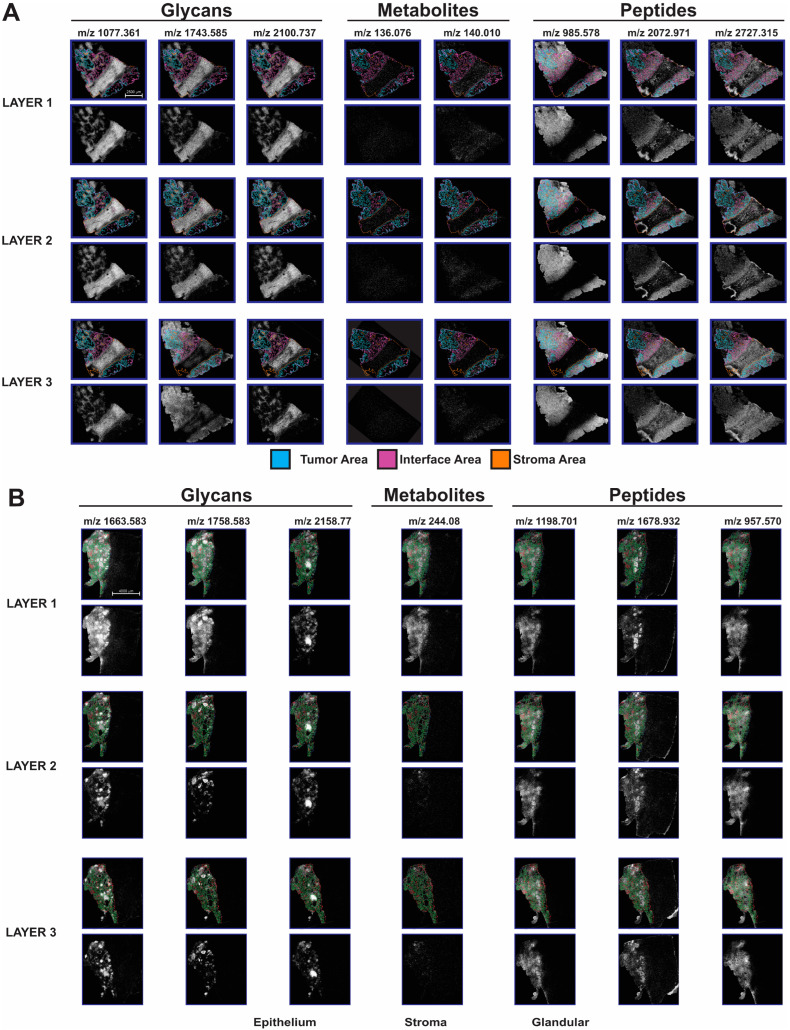
Most platforms used for the molecular reconstruction of the tumor-immune microenvironment (TIME) of a solid tumor fail to explore the spatial context of the three-dimensional (3D) space of the tumor at a single-cell resolution, and thus lack information about cell-cell or cell-extracellular matrix (ECM) interactions. To address this issue, a pipeline which integrated multiplex spatially resolved multi-omics platforms was developed to identify crosstalk signaling networks among various cell types and the ECM in the 3D TIME of two FFPE (formalin-fixed paraffin embedded) gynecologic tumor samples. These platforms include non-targeted mass spectrometry imaging (glycans, metabolites, and peptides) and Stereo-seq (spatial transcriptomics) and targeted seqIF (IHC proteomics). The spatially resolved imaging data in a two- and three-dimensional space demonstrated various cellular neighborhoods in both samples. The collection of spatially resolved analytes in a voxel (3D pixel) across serial sections of the tissue was also demonstrated. Data collected from this analytical pipeline were used to construct spatial 3D maps with single-cell resolution, which revealed cell identity, activation, and energized status. These maps will provide not only insights into the molecular basis of spatial cell heterogeneity in the TIME, but also novel predictive biomarkers and therapeutic targets, which can improve patient survival rates.

Keywords: 3D spatial multi-omics; Stereo-seq; atypical endometrial hyperplasia; mass spectrometry imaging; microbiome; ovarian cancer; tumor microenvironment.


Conflict of interest statement

Authors Trevor D. KcKee and Shamini Ayyadhury are employed by the company Pathomics Inc. The remaining authors declare that the research was conducted in the absence of any commercial or financial relationships that could be construed as a potential conflict of interest.

Figures

Figure 1
Figure 1
Schematic diagram summarizing the 3D targeted and non-targeted multiplexed multi-omics workflow used to dissect the tumor immune microenvironment. (A) For each sample, 5 mm serial FFPE sections from an 85 mm thick tissue block were cut and deposited onto slides specific for each platform. The first and the last sections were stained with H&E for histological evaluation. Every third section was used for non-targeted metabolomics, glycan, and tryptic peptide analysis (by mass spectrometry imaging, MSI), targeted proteomics (by multiplexed sequential immunofluorescence, COMET) or non-targeted spatial transcriptomics (Stereo-seq by STOmics) analyses. (B) Rationale for using serial tissue section for analysis with different modalities. The same cell (average diameter 20 microns) transverses multiple sections (5 microns each, ac), equate to 4–5 sections. (C) Resolution of the three different modalities used in the study, by comparing pixel dimensions.
Figure 2
Figure 2
Multiplex sequential immunofluorescence analysis on HGSOC sample. (A) Whole tissue images overlaid with tissue segmentation mask created based on Keratin8/18 and COL1A1 markers in Visiopharm software for each layer. White boxes represent chosen ROIs for tumor (T), stroma (S) and interface (I) areas shown in panel (B). Scale bar is 3000 µm. (B) Chosen ROIs from panel (A), highlighting corresponding marker expression in tumor, stroma and interface areas. Blue squares represent chosen ROIs shown in panel (C). Scale bar is 450 µm. (C) Chosen ROIs from panel (B), showing differential expression of main immune markers in tumor, stroma and interface areas. Scale bar is 50 µm. (D) 3D reconstruction through rendered voxel stack from assembled layers 1–3. Scale bar is 50 µm.
Figure 3
Figure 3
Non-targeted spatially resolved transcriptomic analysis. (A) UMAPs generated after Stereo-seq analysis for HGSOC sample. (B) Quantitative Leiden cluster analysis and qualitative images for most differentiated genes exported from STereoMap software for each layer and overlaid to seqIF images through Visiopharm software version 2023.09 x64 (tissue segmentation overlay shown in the second panel). Scale bar is 1.5 mm.
Figure 4
Figure 4
Non-targeted metabolomics, glycan, and tryptic peptide analysis by mass spectrometry imaging (MSI). (A,B) Localization of glycans, metabolites and tryptic peptides that correlates with segmented tissue areas for HGSOC (A) and AEH (B) samples. Scale bars 2500µm (A), 4000µm (B).
Figure 5
Figure 5
Demonstration at the region of interest level of the alignment of Leiden clusters with MSI and Comet data. (A) indicates the presence of Leiden clusters within one ROI, which is then indexed for alignment to the other datasets. (B) SAMD4A normalized gene expression (image) is measured for every bun50 ‘voxel’ within the Leiden cluster regions, showing differential expression across discrete Leiden clusters, primarily in stromal regions. (C) CADPS-normalized gene expression (image) shows higher prevalence in Leiden clusters 5 and 13, corresponding to the tumor:stromal interface. In (D), following alignment using the registered indexed cluster, a single peak from the MSI imaging dataset (m/z 1077.361), the MSI pixels corresponding to each bin50 Leiden cluster ‘voxel’ are quantitated in the box plot, showing a similar enhancement of peak intensity matching with stromal and tumor:stromal interface regions of the tissue. In (E), the DAPI (nuclei), Keratin (tumor epithelium) and Col1A (tumor stroma) immunostaining is shown alongside (F) segmented and phenotyped cells, which are then summed within each bin50 voxel to produce (G) box plots indicating the mean number of Keratin+ cells within each bin50 voxel, indicating higher abundance in Leiden clusters 6, 8 and 9, corresponding to tumor enriched Leiden clusters. (H) shows per-voxel cell numbers for ACTA2 (aSMA), with highest abundance at the tumor:stromal interface on Leiden cluster 5.

References

    1. Abdel-Salam G.M.H., Hellmuth S., Gradhand E., Kaseberg S., Winter J., Pabst A.S., Eid M.M., Thiele H., Nürnberg P., Budde B.S., et al. Biallelic MAD2L1BP (p31comet) mutation is associated with mosaic aneuploidy and juvenile granulosa cell tumors. JCI Insight. 2023;8:e170079. doi: 10.1172/jci.insight.170079. - DOI - PMC - PubMed
    1. Yang L., Li A., Wang Y., Zhang Y. Intratumoral microbiota: Roles in cancer initiation, development and therapeutic efficacy. Signal Transduct. Target. Ther. 2023;8:35. doi: 10.1038/s41392-022-01304-4. - DOI - PMC - PubMed
    1. Au Yeung C.L., Co N.N., Tsuruga T., Yeung T.L., Kwan S.Y., Laung C.S., Li Y., Lu E.S., Kwan K., Wong K.-K., et al. Exosomal transfer of stroma-derived miR21 confers paclitaxel resistance in ovarian cancer cells through targeting APAF1. Nat. Commun. 2016;7:11150. doi: 10.1038/ncomms11150. - DOI - PMC - PubMed
    1. Kaymak I., Williams K.S., Cantor J.R., Jones R.G. Immunometabolic Interplay in the Tumor Microenvironment. Cancer Cell. 2021;39:28–37. doi: 10.1016/j.ccell.2020.09.004. - DOI - PMC - PubMed
    1. Bhai P., Turowec J., Santos S., Kerkhof J., Pickard L., Foroutan A., Breadner D., Cecchini M., Levy M.A., Stuart A., et al. Molecular profiling of solid tumors by next-generation sequencing: An experience from a clinical laboratory. Front. Oncol. 2023;13:1208244. doi: 10.3389/fonc.2023.1208244. - DOI - PMC - PubMed