. 2024 Feb 28;16(5):976.
doi: 10.3390/cancers16050976.

Forchlorfenuron-Induced Mitochondrial Respiration Inhibition and Metabolic Shifts in Endometrial Cancer

Affiliations

Forchlorfenuron-Induced Mitochondrial Respiration Inhibition and Metabolic Shifts in Endometrial Cancer

Kyukwang Kim et al. Cancers (Basel). .

Abstract

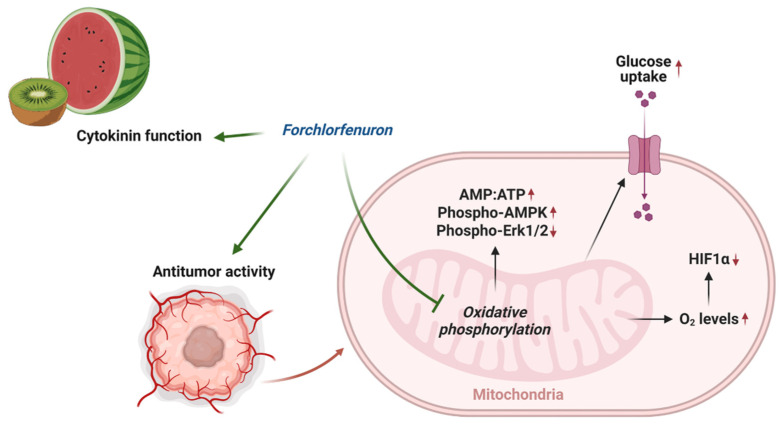
Forchlorfenuron (FCF) is a widely used plant cytokinin that enhances fruit quality and size in agriculture. It also serves as a crucial pharmacological tool for the inhibition of septins. However, the precise target of FCF has not yet been fully determined. This study reveals a novel target of FCF and elucidates its downstream signaling events. FCF significantly impairs mitochondrial respiration and mediates metabolic shift toward glycolysis, thus making cells more vulnerable to glycolysis inhibition. Interestingly, FCF's impact on mitochondrial function persists, even in cells lacking septins. Furthermore, the impaired mitochondrial function leads to the degradation of HIF-1α, facilitated by increased cellular oxygen. FCF also induces AMPK activation, suppresses Erk1/2 phosphorylation, and reduces the expression of HER2, β-catenin, and PD-L1. Endometrial cancer is characterized by metabolic disorders such as diabetes and aberrant HER2/Ras-Erk1/2/β-catenin signaling. Thus, FCF may hold promise as a potential therapeutic in endometrial cancer.

Keywords: AMPK; endometrial cancer; forchlorfenuron; mitochondrial respiration; septins.


Conflict of interest statement

The authors declare no conflicts of interest.

Figures

Figure 1
Figure 1
Expression of septins in endometrial cancer and Kaplan–Meier analysis. (A) TCGA database analyses of septin expression in endometrial cancer. (B) High-septin expressors in (A) (septin 2 and 6–11) were further analyzed by the Kaplan–Meier survival analyses. Among those, the association of SEPT6, 7, or 9 is statistically insignificant (p > 0.05) with patient mortality while the expression of SETP2, 8, 10, and 11 correlates with increased mortality.
Figure 2
Figure 2
Effect of FCF on the proliferation of endometrial cancer cell lines. (A) MFE296 cells were treated with indicated concentrations (μM) of FCF for 24 or 48 h. After treatment, cells were fixed, and their population was measured by the sulforhodamine B (SRB) assay. Cell proliferation is described as a percent increase in cell population compared to that of fixed cells on day 0 (mean ± SEM, N = 3). (B) MFE296 cells were treated as in (A). Cell proliferation was monitored by DNA replication using the 5-bromo-2′-deoxyuridine (BrdU) assay (N = 3). (C) a panel of endometrial cancer cell lines was treated with FCF for 48 h. Cell population was measured by the SRB assay as described in (A). Calculated 50% inhibitory concentrations for each cell line as follows: KLE (38.8 µM), AN3CA (63.7 µM), HEC1A (48.8 µM), RL95-2 (63.2 µM), MFE280 (66.7 µM), MFE296 (92.5 µM), ECC-1 (63.4 µM) (D) cytotoxicity was measured by changes in cell membrane integrity as described in “Materials and Methods”. MFE296 cells were treated with indicated concentrations (μM) of FCF for 24 h. Triton X-100 (TX100, 2%) was included as a positive control for induced cytotoxicity. (E) MFE296 cells treated with FCF (100 μM, 24 h) were divided into three groups, of which cell counting, SRB, or MTS assay was performed to measure cell population. N = 6, ns: not significant, *: p = 0.0163, ****: p < 0.0001. (F,G) MFE296 cells were treated with FCF (100 μM) or cisplatin (CDDP), an apoptosis inducer, for 24 h, after which images were taken (at 20× objective; bar: 50 μm) to determine morphologic features of apoptosis (shrunk and rounded shapes) (F) or cells were lysed, separated by SDS-PAGE electrophoresis, and immunoblotted against apoptosis markers (Clvd Cas-7: cleaved caspase-7; Clvd PARP: cleaved PARP) and a loading control α-tubulin (G).
Figure 3
Figure 3
Inhibitory effect of FCF on Erk1/2 and HER2 phosphorylation. (A) Three different endometrial cancer cell lines, AN3CA, KLE, and MFE296 were treated with FCF (100 μM, 48 h). Protein expression was determined by immunoblotting using specific antibodies as indicated. (B) Immunoblotting of KLE and MFE296 cells treated with FCF (100 μM, 1 h) against Erk1/2, HER2, phospho-Erk1/2 (T202/Y204), and phospho-HER2 (Y1248). (C) KLE and MFE296 cells were treated with lapatinib (1 μM; N = 6) or CI-1040 (15 μM; N = 4) for 24 h. Cell population was measured by the SRB assay. (D) Immunoblotting of cells treated with lapatinib (μM, 2 h; N = 1). (E) Immunoblotting of AN3CA cells treated with FCF (100 μM) or CI-1040 (μM) for 24 h.
Figure 4
Figure 4
FCF alters cellular energy metabolism. (A) A pH change in cell culture media was accessed spectrophotometrically. KLE cells were treated with DMSO or FCF (100 μM) for 24 h, after which culture medium was collected and changes in phenol red absorbance was measured using a ratiometric analysis at 415 and 560 nm. 560 nm is more pronounced at basic pH while 415 nm is at acidic pH. (B) Analysis of lactate secretion into culture medium. KLE cells were treated with FCF (100 μM) overnight. The concentration of lactate in supernatants was measured by enzyme-based lactate oxidation and concomitant NAD+ reduction to NADH. (C) Effect of FCF on glucose uptake. MFE296 cells were treated with FCF for 5 h. Glucose uptake was measured by the addition of a glucose mimic 2-deoxyglucose (2-DG). 2-DG uptake was determined by a bioluminescence-based coupled enzymatic assay as described in “Materials and Methods”. (D,E) MFE296 cells were treated with DMSO or FCF (100 μM) for 18 h. Cell extracts were analyzed for ATP and AMP levels as described in “Materials and Methods”. ATP levels were normalized to the protein concentration of respective sample (D). (F) MFE296 cells were treated with 2-DG (12 mM) or cultured without glucose for 24 h in the presence of FCF (100 µM); Glu(−): glucose deprived, Glu(+): glucose (1 g/L) supplemented. Cell extracts from each condition were analyzed by immunoblotting. (G) As in (F), but treated with various concentrations of 2-DG (mM). The SRB assay was used to measure cell population. (H) As in (F). Cell population was determined by the SRB assay. (*: p < 0.05, **: p < 0.01, ****: p < 0.0001).
Figure 5
Figure 5
FCF impairs mitochondrial respiration. (A,B) MFE296 cells were treated with fixed concentration of FCF (100 μM) for indicated durations (A) or for 7 h with various concentrations (μM) of FCF (B). Immunoblotting was performed to measure total or phosphorylated AMPK (T172), ACC (S79), and Raptor (S792). (C): NSG mice implanted with AN3CA tumors were treated with vehicle (N = 5) or FCF (N = 5, 25 mg/kg, IP, M-F). The average change (+/− 1 SE) in tumor volume from the initiation of treatment estimated from a mixed model (top). After the treatments, AN3CA xenograft tumors were harvested and homogenized using a polytron in radioimmunoprecipitation assay buffer. The resulting mixture was then centrifuged, and the cleared protein extracts were separated by electrophoresis and subjected to immunoblotting using specific antibodies as indicated (bottom). (D) Drug-induced Ca2+ release in MFE296 cells was monitored by a fluorescent Ca2+ binding dye (Fluo-8) as described in “Materials and Methods”. Thapsigargin (Thap) that raises intracellular Ca2+ was included as a positive control. (E) Effect of FCF on oxidative stress. MFE296 cells were treated with FCF (100 μM) and hydrogen peroxide (H2O2, 100 μM) alone or in combination with an antioxidant Trolox (1 mM) for 2 h. The cellular levels of reactive oxygen species (ROS) were measured spectrophotometrically using a carboxy-H2DCFDA probe. (F) As in (E), immunoblotting used for the detection of AMPK phosphorylation (T172). (G) Oxygen consumption rate (OCR) and extracellular acidification (ECAR) measurement in KLE and MFE296 cells as described in “Materials and Methods”. Dot line: drug injection. (H) Effect of FCF on mitochondrial complex I and V. Isolated mitochondria were treated with vehicle, high (300 μM) and low (100 μM) concentrations of FCF, as well as established mitochondrial inhibitors: rotenone (2 μM) targeting complex I, and oligomycin (12.6 μM) targeting complex V. Complex I and V activities were measured as described in “Materials and Methods” monitoring NADH oxidation at 340 nm. (I) 143Bρ0 and 143B cells were treated with FCF or oligomycin at a range of concentrations for 24 h. Cell proliferation was determined by the SRB assay (compared to day 0). Glu(+): glucose (at 4.5 g/L) supplemented; Glu(−): glucose deprived. (J) OCR measured in 143B and 143Bρ0 cells in the presence of DMSO or FCF. Dot line: drug injection.
Figure 6
Figure 6
Impaired mitochondrial respiration by FCF causes HIF1α instability and glucose uptake in MFE296 cells. (A) Cells were cultured under 20% or 5% oxygen in the presence of FCF for 24 h. Cell extracts were collected and subject to immunoblotting with indicated antibodies. (B) Effect of FCF on hypoxia induced genes. Cells were treated as in (A), but for 6 h with FCF (100 μM), after which gene expression of HIF1A, PDK1, SLC2A1 (GLUT1), and SLC2A4 (GLUT4) were analyzed by quantitative RT-PCR. (RQ: relative quantification). (C) As in (A), but cells were treated with FCF or mitochondrial respiratory chain inhibitor for 6 h; oligomycin (1.5 μM, a complex V inhibitor) or BAY87-2243 (1 μM, a complex I inhibitor). (D) As in (C), but cells were co-treated with pimonidazole (20 μM) for 24 h. Pimonidazole is reductively activated during oxygen deprivation and generates protein adducts, which are recognized by a specific mouse monoclonal antibody. (E) Effect of mitochondrial inhibitors on glucose uptake. MFE296 cells were treated with FCF (100 μM), oligomycin (1.5 μM), or BAY87-2243 (1 μM) for 6 h. Glucose uptake was measured as described in Figure 4C. (***: p < 0.001, ****: p < 0.0001) (F) effect of mitochondrial inhibitors on Erk1/2 regulation. Cells were treated as in (E) and subjected to immunoblotting with indicated antibodies. (G,H) Wild-type MFE296 (WT) or double AMPK-α12 knockout (α12-KO) clones were incubated with FCF for 2 h (G) or with AMPK activators, AICAR (1 mM) or A769662 (200 μM), for 6 h (H). Total and phosphorylated proteins were analyzed by immunoblotting against AMPK (T172), ACC (S79), Raptor (S792), and Erk1/2 (T202/Y204).
Figure 7
Figure 7
Effect of septin depletion in MFE296 cells. (A) Transient knockdown of septin-2 and -7 by siRNAs. (B) Septin-7 knockout using the CRISPR/Cas9 system. Cells were transfected with control or septin-7 double nickase plasmid. Following puromycin selection, polyclonal cells were treated with DMSO or FCF (100 μM, 6 h) and subject to immunoblotting with indicated antibodies. (C) Effect of FCF on OCR and ECAR in septin depleted cells. Wild-type MFE296 or single cell derived septin-7 knockout was transfected with siRNAs as indicated. After 48 h, cells were split into 96-well plates (for Seahorse analysis) or 6-well plates (for immunoblotting) and allowed to adhere overnight. Afterwards, expression of septins was analyzed by immunoblotting with specific antibodies to each septins (left), or OCR and ECAR were monitored following DMSO or FCF (100 µM) treatment. y-axis: changes after DMSO or FCF injection (right). (*: p < 0.05, **: p < 0.01, ***: p < 0.001, ****: p < 0.0001)
Figure 8
Figure 8
Overview of mechanism of action of FCF.

Similar articles

References

    1. Shantz E.M., Steward F.C. The Identification of Compound A from Coconut Milk as 1,3-Diphenylurea1. J. Am. Chem. Soc. 1955;77:6351–6353. doi: 10.1021/ja01628a079. - DOI
    1. Bruce M.I., Zwar J.A., Kefford N.P. Chemical structure and plant kinin activity— the activity of urea and thiourea derivatives. Life Sci. 1965;4:461–466. doi: 10.1016/0024-3205(65)90094-9. - DOI
    1. Takahashi S., Shudo K., Okamoto T.K., Yamada K., Isogai Y. Cytokinin activity of N-phenyl-N2-(4-pyridyl)urea derivatives. Phytochemistry. 1978;17:1201–1207. doi: 10.1016/S0031-9422(00)94556-4. - DOI
    1. Iwase M., Okada S., Oguchi T., Toh-e A. Forchlorfenuron, a phenylurea cytokinin, disturbs septin organization in Saccharomyces cerevisiae. Genes Genet. Syst. 2004;79:199–206. doi: 10.1266/ggs.79.199. - DOI - PubMed
    1. Heasley L.R., McMurray M.A. Small molecule perturbations of septins. Methods Cell Biol. 2016;136:311–319. doi: 10.1016/bs.mcb.2016.03.013. - DOI - PubMed