. 2024 Feb 20;25(5):2460.
doi: 10.3390/ijms25052460.

Changes in the Expression of Proteins Associated with Neurodegeneration in the Brains of Mice after Infection with Influenza A Virus with Wild Type and Truncated NS1

Affiliations

Changes in the Expression of Proteins Associated with Neurodegeneration in the Brains of Mice after Infection with Influenza A Virus with Wild Type and Truncated NS1

Karin Donátová et al. Int J Mol Sci. .

Abstract

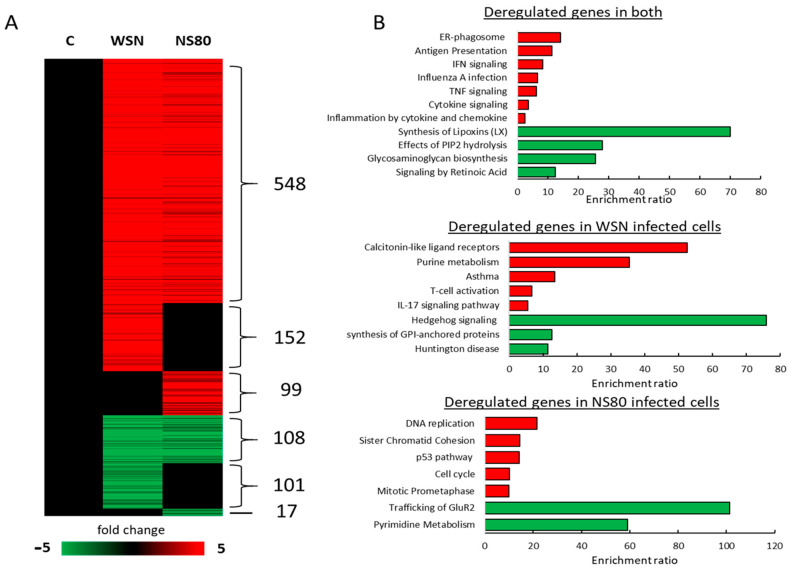
Influenza type A virus (IAV) infection is a major cause of morbidity and mortality during influenza epidemics. Recently, a specific link between IAV infection and neurodegenerative disease progression has been established. The non-structural NS1 protein of IAV regulates viral replication during infection and antagonizes host antiviral responses, contributing to influenza virulence. In the present study, we have prepared a mouse lung-to-lung adapted to the NS1-truncated virus (NS80ad). Transcriptome analysis of the gene expression in the lungs revealed that infection with wild-type A/WSN/33 (WSN), NS80, and NS80ad viruses resulted in different regulation of genes involved in signaling pathways associated with the cell proliferation, inflammatory response, and development of neurodegenerative diseases. NS1 protein did not influence the genes involved in the RIG-I-like receptor signaling pathway in the brains. Lethal infection with IAVs dysregulated expression of proteins associated with the development of neurodegenerative diseases (CX3CL1/Fractalkine, Coagulation factor III, and CD105/Endoglin, CD54/ICAM-1, insulin-like growth factor-binding protein (IGFBP)-2, IGFBP-5, IGFBP-6, chitinase 3-like 1 (CHI3L1), Myeloperoxidase (MPO), Osteopontin (OPN), cystatin C, and LDL R). Transcription of GATA3 mRNA was decreased, and expression of MPO was inhibited in the brain infected with NS80 and NS80ad viruses. In addition, the truncation of NS1 protein led to reduced expression of IGFBP-2, CHI3L1, MPO, and LDL-R proteins in the brains. Our results indicate that the influenza virus influences the expression of proteins involved in brain function, and this might occur mostly through the NS1 protein. These findings suggest that the abovementioned proteins represent a promising target for the development of potentially effective immunotherapy against neurodegeneration.

Keywords: NS1 protein; adaptation; brain; immune response; inflammation; influenza virus; neurodegeneration.


Conflict of interest statement

The authors declare no conflicts of interest.

Figures

Figure 1
Figure 1
(A) Confluent monolayers of Vero cells were infected with viruses at MOI of 0.01 and incubated at 37 °C. At different time points, virus titer in culture medium was determined on Vero cells as described in Materials and Methods. The data shown represent the mean ± SD for three independent experiments. (B) Percentage of body weight loss relative to the initial weights (day 0) was recorded on the 3rd day p.i. in each group of mice infected with influenza virus WSN, WSNad, NS80, and NS80ad. The expression values represent the mean of three separate experiments and are presented as the mean ± SD. Data were statistically evaluated using one-way ANOVA and post hoc Tukey’s HSD test; p < 0.05; p < 0.01; p < 0.001. (C) Percentage of weight of lungs relative to the initial weights (day 0) was recorded on the 3rd day p.i. Results are presented as mean ± SD (n = 3). Statistically significant differences between WSN, WSNad, NS80, and NS80ad are indicated as follows: p < 0.05; p < 0.01; and p < 0.001. (D) The virus titer was determined in the lung tissue homogenates as described in Materials and Methods. Results are presented as mean ± SD (n = 3). Data were statistically evaluated using one-way ANOVA and post hoc Tukey’s HSD test; p < 0.05.
Figure 2
Figure 2
Global gene expression RNA from lungs infected with WSN and NS80 viruses. (A) Heatmap showing fold change expression values of differentially expressed genes (FC ≥ 2, p < 0.05 by DESeq2) in WSN (n = 3) and NS80 (n = 3) infected lungs when compared to uninfected lungs (C, n = 2). (B) KEGG, Panther, and Reactome pathway analysis of genes presented in a. Analysis was performed from genes differentially expressed in both WSN and NS80 infected lungs relative to uninfected lungs (deregulated genes in both); genes differentially expressed only in WSN infected lungs relative to uninfected lungs (deregulated genes in WSN infected cells) and genes differentially expressed only in NS80 infected lungs relative to uninfected lungs (deregulated genes in NS80 infected cells). Red pathways consist of upregulated genes and green pathways of downregulated genes.
Figure 3
Figure 3
KEGG pathway and GO analysis. (A) Schematic representation of key genes involved in the signaling pathways associated with brain damage. Picture was created on BioRender.com, accessed on 15 January 2024. (B) Heatmap of averaged log2(FPKM + 1) values of genes enriched in signaling pathways connected with brain damage (from a.) in WSN (n = 3), NS80 (n = 3), and NS80ad (n = 3) infected lungs. Red color indicates genes with high expression levels, and green color indicates genes with low expression levels.
Figure 4
Figure 4
(A) Heat map showing fold change expression values of subset of differentially expressed genes (FC ≥ 2, p < 0.05 by DESeq2) in NS80ad infected lungs (n = 3) when compared to NS80 infected lungs (n = 3). (B) GSEA, using RNA-seq data, shows negative enrichment in Mitotic sister chromatid segregation and Centriole assembly in NS80ad-infected lungs (n = 3) when compared to NS80-infected lungs (n = 3). Normalized enrichment scores (NES), false discovery rate (FDR), and p-values are shown. (C) GSEA using RNA-seq data shows positive enrichment in response to type II interferon signaling and positive regulation of IL-1 production in NS80ad-infected lungs (n = 3) when compared to NS80-infected lungs (n = 3). Normalized enrichment scores (NES), false discovery rate (FDR), and p-values are shown. (D) GSEA using RNA-seq data shows positive enrichment in neuroinflammatory response in NS80ad-infected lungs (n = 3) when compared to NS80-infected lungs (n = 3). Normalized enrichment scores (NES), false discovery rate (FDR), and p-values are shown. (right) Heatmap showing expression of 37 genes in NS80ad infected lungs (n = 3) and NS80 infected lungs (n = 3) from neuroinflammatory signaling gene set. High expression is indicated by red, while low expression is shown by blue.
Figure 5
Figure 5
(A) Detection of non-adapted and adapted viruses in the brains. Three Balb/c mice were infected with WSN, WSNad, NS80, and NS80ad viruses. The brains were harvested on the 3rd day p.i. Mock represents samples from non-infected brains. RNA was purified from the homogenates, and RT-PCR used primer against M2 protein. (B) Histopathology of brain tissues. Mice’s (Balb/c) brain parts were dissected and fixed on the 3rd day p.i. Sections were obtained using a microtome. Hematoxylin and eosin staining were carried out: Mock—non-infected mice; WSN, WSNad, NS80, and ND80ad-infected mice. Insets show higher magnification views of the selected areas. The necrotic lesions are labeled with arrows. Scale bars: 100 µm.
Figure 6
Figure 6
Induction of RIG-I-like receptor signaling pathways in the brains. BALB/c mice were infected intranasally with LD100 doses of WSN, WSNad, NS80, and NS80ad viruses. The brains were harvested from non-infected mice and from infected mice on the 3rd day p.i., and brain homogenates were used for analyses. Representative (A) reverse transcription PCR blots and (B) relative expression levels of mRNAs were obtained. The expression values represent the mean of three separate brains and are presented as the mean ± SD. Data were statistically evaluated using one-way ANOVA and post hoc Tukey’s HSD test; p < 0.05; p < 0.01; p < 0.001. RIG, retinoic acid-inducible gene; IFN, interferon; IRF, interferon regulatory factor; p.i., post-infection; MDA5, melanoma differentiation-associated gene 5. (C) Immunoblot of IRF3, phosphorylated IRF3, IRF7, and phosphorylated IRF7 in the brains of mice infected with WSN, WSNad, NS80, NS80ad, or mock control. HSC70 served as loading control. (D) Relative expression levels in Western blot are presented as the mean of three independent experiments and presented as the mean ± SD. Data were statistically evaluated using one-way ANOVA and post hoc Tukey’s HSD test; p < 0.05; p < 0.01; p < 0.001.
Figure 7
Figure 7
Induction of cytokines, Th, and macrophage markers in the brains. BALB/c mice were infected intranasally with LD100 doses of WSN, WSNad, NS80, and NS80ad viruses. The brains were harvested from non-infected mice and from infected mice on the 3rd day p.i., and brain homogenates were used for assessment of mRNA levels. Representative (A) reverse transcription PCR blots and (B) relative expression levels of mRNAs were obtained. The expression values represent the mean of three separate brains and are presented as the mean ± SD. Data were statistically evaluated using one-way ANOVA and post hoc Tukey’s HSD test; p < 0.05; p < 0.01; p < 0.001.
Figure 8
Figure 8
Cytokine expression in the brains of mice infected with LD100 doses of WSN, WSNad, NS80, and NS80ad viruses. Protein expression levels of cytokines in the brain of infected mice harvested on the 3rd day p.i. were determined by cytokine array. The expression levels of cytokines were normalized to the expression level of reference spots. The assay was performed in duplicate to ensure reproducibility of the results. Results are presented as mean ± SD (n = 3). Data were statistically evaluated using one-way ANOVA and post hoc Tukey’s HSD test; p < 0.05; p < 0.01; p < 0.001.

Similar articles

Cited by

References

    1. Fislová T., Gocník M., Sládková T., Durmanová V., Rajcáni J., Varecková E., Mucha V., Kostolanský F. Multiorgan distribution of human influenza A virus strains observed in a mouse model. Arch. Virol. 2009;154:409–419. doi: 10.1007/s00705-009-0318-8. - DOI - PubMed
    1. Atluri V.S., Hidalgo M., Samikkannu T., Kurapati K.R., Nair M. Synaptic Plasticity and Neurological Disorders in Neurotropic Viral Infections. Neural Plast. 2015;2015:138979. doi: 10.1155/2015/138979. - DOI - PMC - PubMed
    1. Hosseini S., Wilk E., Michaelsen-Preusse K., Gerhauser I., Baumgärtner W., Geffers R., Schughart K., Korte M. Long-Term Neuroinflammation Induced by Influenza A Virus Infection and the Impact on Hippocampal Neuron Morphology and Function. J. Neurosci. 2018;38:3060–3080. doi: 10.1523/JNEUROSCI.1740-17.2018. - DOI - PMC - PubMed
    1. Barbosa-Silva M.C., Santos L.E., Rangel B.J. The Impact of Non-Neurotropic Influenza Strains on the Brain: A Role for Microglial Priming? J. Neurosci. 2018;38:7758–7760. doi: 10.1523/JNEUROSCI.1368-18.2018. - DOI - PMC - PubMed
    1. Kristensson K. Avian influenza and the brain--comments on the occasion of resurrection of the Spanish flu virus. Brain Res. Bull. 2006;68:406–413. doi: 10.1016/j.brainresbull.2005.11.022. - DOI - PubMed