Conformational Space of the Translocation Domain of Botulinum Toxin: Atomistic Modeling and Mesoscopic Description of the Coiled-Coil Helix Bundle
- PMID: 38473729
- PMCID: PMC10931374
- DOI: 10.3390/ijms25052481
Conformational Space of the Translocation Domain of Botulinum Toxin: Atomistic Modeling and Mesoscopic Description of the Coiled-Coil Helix Bundle
Abstract
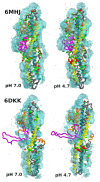
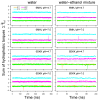
The toxicity of botulinum multi-domain neurotoxins (BoNTs) arises from a sequence of molecular events, in which the translocation of the catalytic domain through the membrane of a neurotransmitter vesicle plays a key role. A recent structural study of the translocation domain of BoNTs suggests that the interaction with the membrane is driven by the transition of an α helical switch towards a β hairpin. Atomistic simulations in conjunction with the mesoscopic Twister model are used to investigate the consequences of this proposition for the toxin-membrane interaction. The conformational mobilities of the domain, as well as the effect of the membrane, implicitly examined by comparing water and water-ethanol solvents, lead to the conclusion that the transition of the switch modifies the internal dynamics and the effect of membrane hydrophobicity on the whole protein. The central two α helices, helix 1 and helix 2, forming two coiled-coil motifs, are analyzed using the Twister model, in which the initial deformation of the membrane by the protein is caused by the presence of local torques arising from asymmetric positions of hydrophobic residues. Different torque distributions are observed depending on the switch conformations and permit an origin for the mechanism opening the membrane to be proposed.
Keywords: Clostridium botulinum; botulinum toxin; hydrophobicity; mesoscopic Twister model; molecular dynamics; residue protonation; water–ethanol solvent.
Conflict of interest statement
The authors declare no conflicts of interest.
Figures


Similar articles
-
In Silico Conformational Features of Botulinum Toxins A1 and E1 According to Intraluminal Acidification.Toxins (Basel). 2022 Sep 17;14(9):644. doi: 10.3390/toxins14090644. Toxins (Basel). 2022. PMID: 36136581 Free PMC article.
-
Protein Domain Analysis of C. botulinum Type A Neurotoxin and Its Relationship with Other Botulinum Serotypes.Toxins (Basel). 2010 Jan;2(1):1-9. doi: 10.3390/toxins2010001. Epub 2009 Dec 24. Toxins (Basel). 2010. PMID: 22069543 Free PMC article.
-
Domain organization in Clostridium botulinum neurotoxin type E is unique: its implication in faster translocation.J Mol Biol. 2009 Feb 13;386(1):233-45. doi: 10.1016/j.jmb.2008.12.027. Epub 2008 Dec 24. J Mol Biol. 2009. PMID: 19118561
-
Botulinum and Tetanus Neurotoxins.Annu Rev Biochem. 2019 Jun 20;88:811-837. doi: 10.1146/annurev-biochem-013118-111654. Epub 2018 Nov 2. Annu Rev Biochem. 2019. PMID: 30388027 Free PMC article. Review.
-
On the translocation of botulinum and tetanus neurotoxins across the membrane of acidic intracellular compartments.Biochim Biophys Acta. 2016 Mar;1858(3):467-74. doi: 10.1016/j.bbamem.2015.08.014. Epub 2015 Aug 22. Biochim Biophys Acta. 2016. PMID: 26307528 Review.
Cited by
-
Special Issue: "Molecular Dynamics Simulations and Structural Analysis of Protein Domains".Int J Mol Sci. 2024 Oct 8;25(19):10793. doi: 10.3390/ijms251910793. Int J Mol Sci. 2024. PMID: 39409122 Free PMC article.
References
-
- Coetzee S., Nunez N., Belaunzaran M., Mark J., Stickler M.A. Beyond Wrinkles: A Comprehensive Review of the Uses of Botulinum Toxin. J. Drugs Dermatol. 2023;22:7243e. - PubMed
MeSH terms
Substances
Grants and funding
LinkOut - more resources
Full Text Sources

