. 2024 Feb 20;25(5):2483.
doi: 10.3390/ijms25052483.

Plasma Lipidomic Profiling Using Mass Spectrometry for Multiple Sclerosis Diagnosis and Disease Activity Stratification (LipidMS)

Affiliations

Plasma Lipidomic Profiling Using Mass Spectrometry for Multiple Sclerosis Diagnosis and Disease Activity Stratification (LipidMS)

Seyed Siyawasch Justus Lattau et al. Int J Mol Sci. .

Abstract

This investigation explores the potential of plasma lipidomic signatures for aiding in the diagnosis of Multiple Sclerosis (MS) and evaluating the clinical course and disease activity of diseased patients. Plasma samples from 60 patients with MS (PwMS) were clinically stratified to either a relapsing-remitting (RRMS) or a chronic progressive MS course and 60 age-matched controls were analyzed using state-of-the-art direct infusion quantitative shotgun lipidomics. To account for potential confounders, data were filtered for age and BMI correlations. The statistical analysis employed supervised and unsupervised multivariate data analysis techniques, including a principal component analysis (PCA), a partial least squares discriminant analysis (oPLS-DA) and a random forest (RF). To determine whether the significant absolute differences in the lipid subspecies have a relevant effect on the overall composition of the respective lipid classes, we introduce a class composition visualization (CCV). We identified 670 lipids across 16 classes. PwMS showed a significant increase in diacylglycerols (DAG), with DAG 16:0;0_18:1;0 being proven to be the lipid with the highest predictive ability for MS as determined by RF. The alterations in the phosphatidylethanolamines (PE) were mainly linked to RRMS while the alterations in the ether-bound PEs (PE O-) were found in chronic progressive MS. The amount of CE species was reduced in the CPMS cohort whereas TAG species were reduced in the RRMS patients, both lipid classes being relevant in lipid storage. Combining the above mentioned data analyses, distinct lipidomic signatures were isolated and shown to be correlated with clinical phenotypes. Our study suggests that specific plasma lipid profiles are not merely associated with the diagnosis of MS but instead point toward distinct clinical features in the individual patient paving the way for personalized therapy and an enhanced understanding of MS pathology.

Keywords: biomarker; lipidmetabolism; lipidomics; multiple sclerosis.


Conflict of interest statement

S.S.J.L., L.-M.B., K.a.d.B., L.V., M.N. and D.F. declare no conflicts of interest. C.K. is an employee and shareholder of Lipotype GmbH, Dresden.

Figures
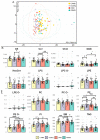
Figure 1
Figure 1
(A) Principal Component Analysis (PCA) plot illustrating the lipid subspecies distribution from 120 participants. The variance explained by PC1 is 76.61% and PC2 is 13.79%. Ellipses represent the 95% confidence intervals for each cohort. (B) Bar chart illustrating the concentration [pmol] with SD for the 16 lipid classes. Statistical significance was determined by a one-way ANOVA, followed by the TUKEY-HSD: * = p-value < 0.05; ** = p-value < 0.01; *** = p-value < 0.001; **** = p-value < 0.0001 (Supplementary Table S3).
Figure 2
Figure 2
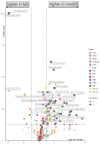
Volcano plot showing the differences in lipid subspecies in subjects without MS (healthy and OND) vs. subjects with MS (RRMS and CPMS). Colors represent lipid class classification. The size of the dots is determined by the VIP score from the comparative oPLS-DA (Supplementary Figure S7A). Lipids marked with red × have a high correlation with age and BMI (Supplementary Figure S6). The horizontal dashed line indicates a p-value of 0.05 in the Welch’s t-test. The vertical dashed line indicates a log2 fold change of 1. Only lipids with a p-value < 0.01 and a log2 fold change > 1.5 and no relevant correlation with age and BMI were annotated.
Figure 3
Figure 3
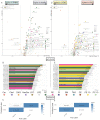
Volcano plot showing the differences in lipid subspecies in healthy subjects vs. patients with RRMS (A) and subjects with OND vs. CPMS (D). Colors represent lipid class classification. Lipids marked with red × have a high correlation with age and BMI (Supplementary Figure S6). The horizontal dashed line indicates a p-value of 0.05 in the Welch’s t-test. The vertical dashed line indicates a log2 fold change of 1. Only lipids with a p-value < 0.01 and a log2 fold change > 1.5 and no relevant correlation with age and BMI were annotated. The size of the dots is determined by the VIP score from the oPLS-DA (B,E). (B) Bar chart displaying the lipids with the top 30 VIP scores with SD of oPLS-DA healthy vs. RRMS (Supplementary Figure S8). (E) Bar chart displaying the lipids with the top 30 VIP scores with SD of oPLS-DA OND vs. CPMS (Supplementary Figure S8). Colors in (B,E) represent lipid class classification. Lipids with a high correlation with age and BMI are greyed out and annotated. Confusion matrix of the oPLS-DA of healthy vs. RRMS (C) and OND vs. CPMS (F) on the 40% hold out test dataset (testing data) ensuring the predictive capability of the important lipids provided by the oPLS-DA.
Figure 4
Figure 4
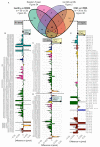
Cohort-Specific Significantly Altered Lipids. (A) Venn-Diagram illustrating the overlaps in the significantly altered lipids across three comparative analyses using oPLS-DA and Volcano: “healthy vs. RRMS (Figure 3A)”, “non-MS vs. MS (Figure 2)” and “OND vs. CPMS (Figure 3D)” and the Random Forest machine learning classification “non-MS vs. MS (Figure 5A)”. By analyzing the overlaps presented in the Venn diagram, it becomes evident which lipid alterations are specific to individual cohorts. This overlap-based approach enables a precise identification of cohort-specific lipidomic signatures. The individual lipids of these signatures are shown in (BE). (B) Represents the signature for the RRMS cohort. (C,D) Illustrate the common overlap of lipids that are altered regardless of MS progression. (E) Represents the signature for the CPMS cohort. The horizontal bar plots detail the absolute difference amount within the range of −0.05 to 0.05 pmol (mean differences beyond this range truncated) along with their 95% confidence intervals.
Figure 5
Figure 5
Random forest and class composition visualization. (A) Shows the top 30 lipids considered most discriminative by the random forest model when comparing (healthy and OND vs. RRMS and CPMS), ranked by their mean decrease in accuracy. Notably, DAG 16:0;0_18:1;0 emerges as the most discriminative lipid. The predictive ability of the model was measured using a separate test dataset, as shown in (B). To determine whether the marked absolute differences in lipid subspecies shown in Figure 4B–E significantly influence the overall composition of the associated lipid class, we calculated the total class quantity in each cohort and visualized the significantly altered lipids based on their cohort specificity determined by Figure 4A. This approach is illustrated as a class composition visualization in (C).
Figure 6
Figure 6
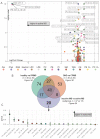
Differences in lipid compositions in inactive MS vs. active MS. (A) Volcano plot showing the differences in lipid subspecies in patients with inactive MS vs. patients with active MS. Colors represent lipid class classification. Lipids marked with red × have a high correlation with age and BMI (Supplementary Figure S6). The horizontal dashed line indicates a p-value of 0.05 using the Welch’s t-test. The vertical dashed line indicates a log2 fold change of 1. Only lipids with a p-value < 0.0001 and no relevant correlation with age and BMI were annotated; (B) comparing the overlaps of significantly altered lipids from the prior comparative analyses of “healthy vs. RRMS (Figure 3A)” and “OND vs. CPMS (Figure 3D)” to “inactive MS vs. active MS (A)”. We identified 20 lipids that are significantly altered only in patients with active MS. (C) Illustrates these significantly altered lipids by presenting the differences in pmol with SD.

Similar articles

Cited by

References

    1. Wallin M.T., Culpepper W.J., Nichols E., Bhutta Z.A., Gebrehiwot T.T., Hay S.I., Khalil I.A., Krohn K.J., Liang X., Naghavi M., et al. Global, Regional, and National Burden of Multiple Sclerosis 1990–2016: A Systematic Analysis for the Global Burden of Disease Study 2016. Lancet Neurol. 2019;18:269–285. doi: 10.1016/S1474-4422(18)30443-5. - DOI - PMC - PubMed
    1. Villoslada P., Alonso C., Agirrezabal I., Kotelnikova E., Zubizarreta I., Pulido-Valdeolivas I., Saiz A., Comabella M., Montalban X., Villar L., et al. Metabolomic Signatures Associated with Disease Severity in Multiple Sclerosis. Neurol. Neuroimmunol. Neuroinflamm. 2017;4:e321. doi: 10.1212/NXI.0000000000000321. - DOI - PMC - PubMed
    1. Pousinis P., Ramos I.R., Woodroofe M.N., Cole L.M. Lipidomic UPLC-MS/MS Profiles of Normal-Appearing White Matter Differentiate Primary and Secondary Progressive Multiple Sclerosis. Metabolites. 2020;10:366. doi: 10.3390/metabo10090366. - DOI - PMC - PubMed
    1. Penkert H., Lauber C., Gerl M.J., Klose C., Damm M., Fitzner D., Flierl-Hecht A., Kümpfel T., Kerschensteiner M., Hohlfeld R., et al. Plasma Lipidomics of Monozygotic Twins Discordant for Multiple Sclerosis. Ann. Clin. Transl. Neurol. 2020;7:2461–2466. doi: 10.1002/acn3.51216. - DOI - PMC - PubMed
    1. Ziemssen T., Akgün K., Brück W. Molecular Biomarkers in Multiple Sclerosis. J. Neuroinflamm. 2019;16:272. doi: 10.1186/s12974-019-1674-2. - DOI - PMC - PubMed