. 2024 Feb 21;25(5):2504.
doi: 10.3390/ijms25052504.

Bisphenol A: Unveiling Its Role in Glioma Progression and Tumor Growth

Affiliations

Bisphenol A: Unveiling Its Role in Glioma Progression and Tumor Growth

Liang Niu et al. Int J Mol Sci. .

Abstract

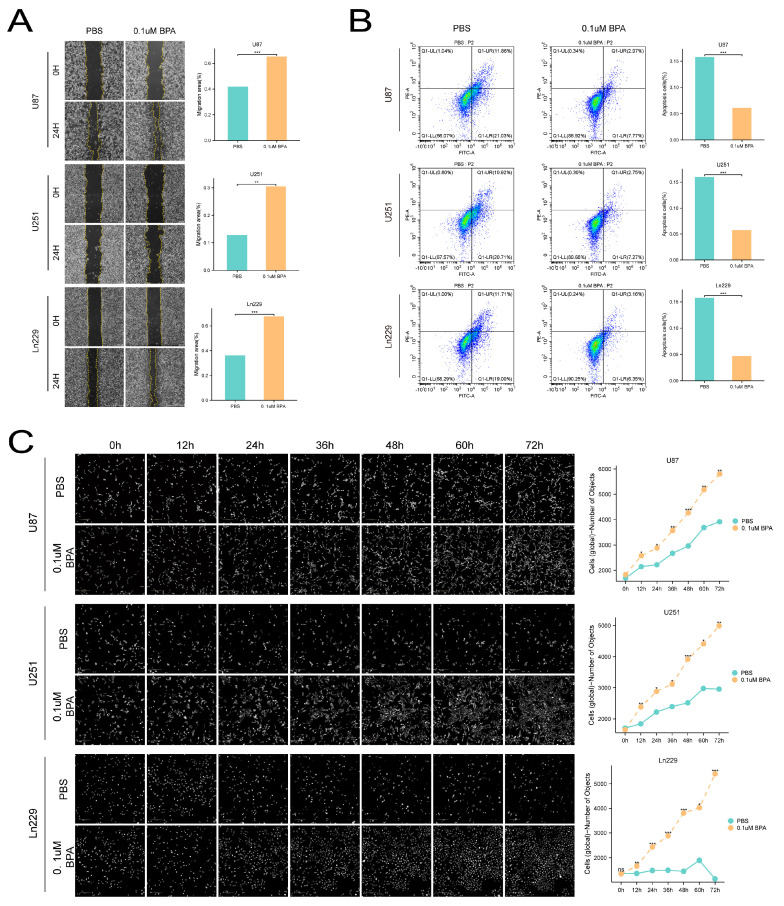
Gliomas represent the most common and lethal category of primary brain tumors. Bisphenol A (BPA), a widely recognized endocrine disruptor, has been implicated in the progression of cancer. Despite its established links to various cancers, the association between BPA and glioma progression remains to be clearly defined. This study aimed to shed light on the impact of BPA on glioma cell proliferation and overall tumor progression. Our results demonstrate that BPA significantly accelerates glioma cell proliferation in a time- and dose-dependent manner. Furthermore, BPA has been found to enhance the invasive and migratory capabilities of glioma cells, potentially promoting epithelial-mesenchymal transition (EMT) characteristics within these tumors. Employing bioinformatics approaches, we devised a risk assessment model to gauge the potential glioma hazards associated with BPA exposure. Our comprehensive analysis revealed that BPA not only facilitates glioma invasion and migration but also inhibits apoptotic processes. In summary, our study offers valuable insights into the mechanisms by which BPA may promote tumorigenesis in gliomas, contributing to the understanding of its broader implications in oncology.

Keywords: bisphenol A (BPA); cell proliferation; glioma; melatonin.


Conflict of interest statement

The authors declare no conflicts of interest.

Figures

Figure 1
Figure 1
Gene ontology enrichment analysis of BPA-related genes: (A) This panel illustrates the significant enrichment of genes involved in the response to steroid hormones and oxidative stress. Colored connections represent the interaction between genes and their associated biological processes, highlighting the coordinated regulation of cellular responses to environmental stimuli. (B) Shown here are the cellular components enriched in genes that include nuclear receptor activity, steroid binding, and hormone receptor binding. The distribution of genes across these components suggests their collective role in signaling pathways and receptor-mediated mechanisms. (C) This section depicts the molecular functions and cellular components associated with membrane microdomains, protein kinase complexes, and the structures of organelles. Each arc illustrates the specific contribution of genes to the functional complexity of the cell’s architecture and signaling systems.
Figure 2
Figure 2
Bisphenol score analysis and correlation with tumor microenvironment in glioma. (A) This dendrogram illustrates the distribution of bisphenol-related scores across the glioma cohort. Scores were derived from ssGSEA analysis, showing the hierarchical clustering of patients based on their score magnitude. (B) The heatmap displays bisphenol-related scores across individual glioma patients. Each column represents a patient, with color intensity corresponding to the score magnitude, revealing the diversity of bisphenol’s influence within the cohort. (C) This bar chart divides the cohort into high and low bisphenol score groups. The bars represent the percentage of patients in each group, demonstrating the binary classification based on the ssGSEA-derived scores. (D) Violin plots illustrate the positive correlation between high bisphenol scores and immune, stromal, and ESTIMATE scores in glioma patients. The width of each plot indicates the density of data points at different score levels. *** = p ≤ 0.001.
Figure 3
Figure 3
Association of bisphenol-related scores with glioma grade. (A) The bar plots represent the proportions of glioma patients with high and low bisphenol-related scores according to age, gender, and tumor grade. The colors denote different demographic and clinical characteristics, providing a clear visualization of their distribution across the scores. (BD) These panels break down the proportions of patients with high and low bisphenol-related scores by age (B), gender (C), and tumor grade (D). The stacked bars show the percentages within each score category, revealing patterns of association with these key patient demographics and tumor characteristics. *** = p ≤ 0.001.
Figure 4
Figure 4
Prognostic gene identification and risk stratification in glioma based on BPA association. (A) Volcano plot displaying the differentially expressed genes between BPA-low and BPA-high groups in the glioma cohort. Genes are color-coded based on significance and direction of expression change, with key genes highlighted. (B) Forest plot illustrating hazard ratios for individual genes identified in the univariate COX regression analysis. Bars represent the 95% confidence intervals, indicating the prognostic impact of each gene on survival. (C) Profile plot showing the selection of optimal prognostic genes using LASSO regression. The plot traces the changes in the LASSO coefficients as the penalty parameter lambda is varied. (D) The top panel is a heatmap of the expression levels of key prognostic genes across the glioma cohort, with patients ordered by increasing risk score. The bottom panel is a scatter plot showing the distribution of survival times for patients, color-coded by risk category. (E) Kaplan–Meier curves comparing overall survival between low- and high-risk patient groups, with risk determined by the prognostic model. The shaded area represents the 95% confidence interval, and the number of patients at risk over time is listed below.
Figure 5
Figure 5
Clinical correlation and predictive performance of BPA-related risk model for glioma. (A) Bar chart summarizing the distribution of clinical features such as age, gender, and tumor grade across high and low BPA-related risk scores in the glioma cohort. (BD) These bar charts compare the percentage of glioma patients with low and high BPA-related risk scores across different age groups (B), genders (C), and tumor grades (D), illustrating the correlation between risk scores and clinical features. (E) Forest plot displaying the hazard ratios for age, gender, tumor grade, and risk score derived from univariate analysis. Bars represent confidence intervals, indicating the strength of each factor’s association with patient prognosis. (F) Forest plot showing hazard ratios for the same clinical features from multivariate analyses, confirming their status as independent risk factors. (G) The nomogram integrates clinical features with the BPA-related risk scores to predict individual patient survival. Points are assigned for each variable, which correspond to a predicted survival probability at specific time points. (H) The receiver operating characteristic (ROC) curve evaluates the predictive accuracy of the BPA-based risk model over different time points. The area under the curve (AUC) values provide a measure of the model’s performance. *** = p ≤ 0.001.
Figure 6
Figure 6
CCK8, Transwell, colony formation, and EdU experiments conducted on U87, U251, and Ln229 cell lines revealed that a concentration of 0.1 µM BPA stimulates the proliferation, migration, and invasion of glioma cells. (A) The CCK8 assay yielded findings that indicate BPA’s capacity to stimulate the proliferation of glioma cells, although it is noteworthy that a concentration of 100 µM exhibited a decelerating effect on growth. (B) The presence of 0.1 µM BPA enhances the invasion and migration of glioma cells. The (C) colony formation and (D) EdU assays both showed that 0.1 µM BPA significantly augmented the glioma cells’ aptitude for clone formation and proliferation. ns = p > 0.05, * = p ≤ 0.05, ** = p ≤ 0.01, *** = p ≤ 0.001.
Figure 7
Figure 7
(A) The wound healing assay confirmed that a concentration of 0.1 µM BPA enhanced the migration of U87, U251, and Ln229 cells. (B) BPA also inhibited apoptosis in glioma cells compared to the control group that did not receive BPA treatment. (C) The proportion of early and late apoptosis was significantly decreased. High-content DPC analysis showed that BPA-treated glioma cells exhibited accelerated growth without any observable signs of apoptosis, such as nuclear fragmentation or cell death, throughout the growth process. ns = p > 0.05, * = p ≤ 0.05, ** = p ≤ 0.01, *** = p ≤ 0.001.
Figure 8
Figure 8
(A,B) Melatonin (MT) mitigated the effects of BPA. Co-treatment with melatonin notably decreased the proliferation rate of glioma cells and restricted their invasion and migration capabilities. * = p ≤ 0.05, ** = p ≤ 0.01, *** = p ≤ 0.001.

Similar articles

Cited by

References

    1. Rao J.S. Molecular mechanisms of glioma invasiveness: The role of proteases. Nat. Rev. Cancer. 2003;3:489–501. doi: 10.1038/nrc1121. - DOI - PubMed
    1. Johansen M.D., Rochat P., Law I., Scheie D., Poulsen H.S., Muhic A. Presentation of Two Cases with Early Extracranial Metastases from Glioblastoma and Review of the Literature. Case Rep. Oncol. Med. 2016;2016:8190950. doi: 10.1155/2016/8190950. - DOI - PMC - PubMed
    1. Lu D.Y., Leung Y.M., Cheung C.W., Chen Y.R., Wong K.L. Glial cell line-derived neurotrophic factor induces cell migration and matrix metalloproteinase-13 expression in glioma cells. Biochem. Pharmacol. 2010;80:1201–1209. doi: 10.1016/j.bcp.2010.06.046. - DOI - PubMed
    1. Wang X., Nag R., Brunton N.P., Siddique M.A.B., Harrison S.M., Monahan F.J., Cummins E. Human health risk assessment of bisphenol A (BPA) through meat products. Env. Res. 2022;213:113734. doi: 10.1016/j.envres.2022.113734. - DOI - PubMed
    1. Song H., Zhang T., Yang P., Li M., Yang Y., Wang Y., Du J., Pan K., Zhang K. Low doses of bisphenol A stimulate the proliferation of breast cancer cells via ERK1/2/ERRγ signals. Toxicol. Vitro. 2015;30 Pt B:521–528. doi: 10.1016/j.tiv.2015.09.009. - DOI - PubMed

LinkOut - more resources