. 2024 Feb 21;25(5):2506.
doi: 10.3390/ijms25052506.

Unlocking the Transcriptional Control of NCAPG in Bovine Myoblasts: CREB1 and MYOD1 as Key Players

Affiliations

Unlocking the Transcriptional Control of NCAPG in Bovine Myoblasts: CREB1 and MYOD1 as Key Players

Zongchang Chen et al. Int J Mol Sci. .

Abstract

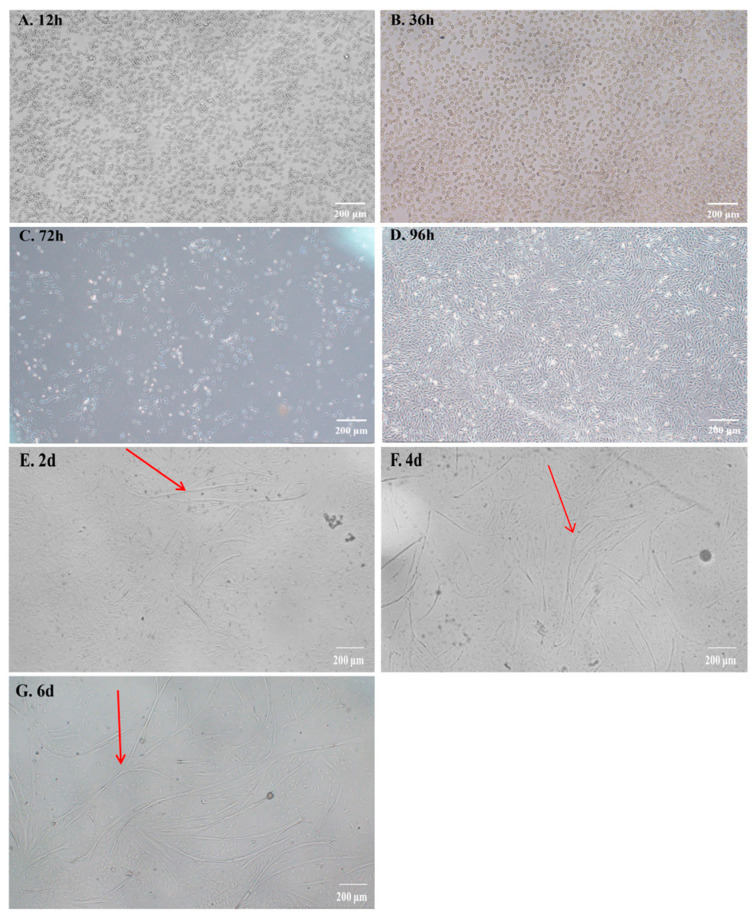
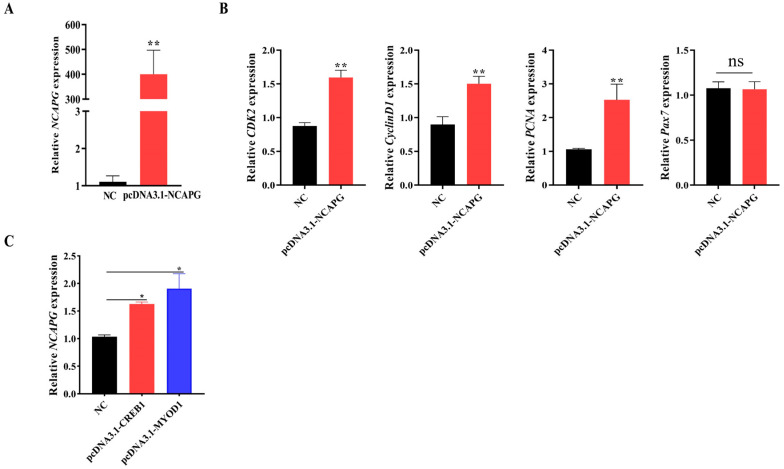
Muscle formation directly determines meat production and quality. The non-SMC condensin I complex subunit G (NCAPG) is strongly linked to the growth features of domestic animals because it is essential in controlling muscle growth and development. This study aims to elucidate the tissue expression level of the bovine NCAPG gene, and determine the key transcription factors for regulating the bovine NCAPG gene. In this study, we observed that the bovine NCAPG gene exhibited high expression levels in longissimus dorsi and spleen tissues. Subsequently, we cloned and characterized the promoter region of the bovine NCAPG gene, consisting of a 2039 bp sequence, through constructing the deletion fragment double-luciferase reporter vector and site-directed mutation-identifying core promoter region with its key transcription factor binding site. In addition, the key transcription factors of the core promoter sequence of the bovine NCAPG gene were analyzed and predicted using online software. Furthermore, by integrating overexpression experiments and the electrophoretic mobility shift assay (EMSA), we have shown that cAMP response element binding protein 1 (CREB1) and myogenic differentiation 1 (MYOD1) bind to the core promoter region (-598/+87), activating transcription activity in the bovine NCAPG gene. In conclusion, these findings shed important light on the regulatory network mechanism that underlies the expression of the NCAPG gene throughout the development of the muscles in beef cattle.

Keywords: NCAPG; bovine; myoblast; promoter; transcriptional regulation.


Conflict of interest statement

The authors declare that the research was conducted in the absence of any commercial or financial relationships that could be construed as potential conflicts of interest.

Figures

Figure 1
Figure 1
The proliferation and differentiation of bovine myoblasts. (AD) Bovine myoblasts proliferated in different periods. (EG) Bovine myoblasts induced differentiation in different periods. The red arrows indicate myotubes formed after induced differentiation; scale bar = 200 µm.
Figure 2
Figure 2
Identification of bovine myoblasts. (A) Expression of myoblast-related marker genes was determined via reverse transcription PCR. M: Marker; GAPDH: internal control. (B) The expression levels of NCAPG, Pax7, PCNA, CDK2, and CyclinD1 genes at h 12, 24, 36, and 48 after bovine myoblast proliferation. The results are represented as the mean ± the SD based on three independent experiments. (C) Identification of bovine myoblasts based on Pax7 and MYH7 expression in growth medium for 48 h. The nucleus emits blue fluorescence, and the green spots indicate Pax7 and MYH7 fluorescence staining. Scale bar = 200 µm. * indicates significance at p < 0.05, and ** indicates significance at p < 0.01 compared to the control group; ns: not significant. Error bars represent the SD.
Figure 3
Figure 3
Sequence analysis and inferred phylogenetic tree of the NCAPG gene. (A) The detailed genomic, mRNA, and protein components containing the 5′/3′-untranslated region (5′/3′-UTR), and the CDS of bovine NCAPG. The figure omits the sequence from exon 5 to exon 18, as indicated by the dotted lines. (B) Phylogenetic tree of amino acids in the NCAPG protein of nine species, including Bos taurus. The left image shows the clustering of the NCAPG protein in different species, and the right shows the architecture and characteristics of the NCAPG protein amino acid length in corresponding species.
Figure 4
Figure 4
Gene expression of NCAPG in different tissues. The relative expression pattern of the NCAPG gene was detected using quantitative real-time PCR in a range of bovine tissues, and the lung was set as unit 1 to compare different tissues. The results are represented as the mean ± the SD based on three independent experiments. ** indicates significance at p < 0.01 compared to the control group. Error bars represent the SD.
Figure 5
Figure 5
Construction of fragment deletion of the NCAPG gene promoter and the isolation and sequence analysis of the functional proximal minimal promoter of NCAPG. (A) Relative luciferase activity of different promoter fragments. These plasmids were transfected into C2C12. The results are expressed as the mean ± the SD in arbitrary units based on the firefly luciferase activity normalized against the Renilla luciferase activity for triplicate transfections. (B) The sequence of the 5′ regulatory region of bovine NCAPG. Arrows indicate the transcription initiation sites. The TF binding sites and regulatory elements are shown in boxes. (C) Schematic representation of the proximal promoter region (+87 to −1952 base pairs) of the bovine NCAPG gene to predict the regions with high GC content. Dashed lines indicate the GC percentage as represented by the y-axis, and the x-axis denotes the bp position in the 5′ untranslated region; vertical lines indicate the relative positions of CpG islands. Coordinates are given relative to the translational start site (shown as +1) * indicates significance at p < 0.05, and ** indicates significance at p < 0.01 compared to the control group. Error bars represent the SD.
Figure 6
Figure 6
Analysis of transcriptional activity for the corresponding transcription factor in bovine myoblast cells. (A) Site-directed mutagenesis for MYOD1 and CREB1 sites was carried out in the construct pGL−598/+87. The correspondence constructs were transiently transfected into myoblasts, and the pGL−598/+87 construct was used as a negative control (NC). White and black filled shaped in sequence depictions represent wild and mutant types, respectively. (B,C) Overexpression efficiency of pcDNA3.1-MYOD1 and pcDNA3.1-CREB1. The pcDNA3.1(+) empty vector was used as a negative control (NC). (D) Luciferase reporter assays after MYOD1 and CREB1 overexpression via co-transfection with pGL−598/+87 in bovine myoblasts. The pGL3−598/+87 and pcDNA3.1(+) empty-vector co-transfection groups were used as a negative control (NC). (E) Multiple sequence alignment of the MYOD1 and CREB1 transcription factor binding sites in the promoter region of the NCAPG gene in different species. The box depicts MYOD1 and CREB1 consensus binding sites. * indicates significance at p < 0.05, and ** indicates significance at p < 0.01 compared to the control group. Error bars represent the SD.
Figure 7
Figure 7
Identification of TF binding to the core promoter of NCAPG using EMSA. (A) EMSA tests confirmed the binding of the transcription factor MYOD1 to the NCAPG promoter in vitro. (B) EMSA tests confirmed the binding of the transcription factor CREB1 to the NCAPG promoter in vitro. Nuclear protein extracts were incubated with a 5′ biotin-labeled probe containing the MYOD1 and CREB1 binding site in the presence or absence of a competitor (lane 4), mutation probe (lane 3), and unlabeled probe (lane 2). The super-shift assay was conducted using 10 μg of Anti-MYOD1 and Anti-CREB1 antibodies (lane 5). Arrows indicate DNA–nuclear-protein complexes.
Figure 8
Figure 8
NCAPG regulated the relative expression of myogenesis marker genes. (A) Overexpression efficiency of pcDNA3.1-NCAPG. The pcDNA3.1(+) empty vector was used as negative control (NC). (B) The relative expression levels of marker genes in bovine myoblasts. (C) The NCAPG mRNA relative expression after transfection with different TF overexpression vectors. The pcDNA3.1(+) empty vector was used as a negative control (NC). * indicates significance at p < 0.05, and ** indicates significance at p < 0.01 compared to the control group. ns: not significant. Error bars represent the SD.
Figure 9
Figure 9
A model summary of NCAPG regulation by MYOD1 and CREB1 transcription factors. In short, MYOD1 and CREB1 increased the NCAPG promoter activity, and the overexpression of NCAPG enhanced the expression of marker genes of CDK2, CyclinD1, and PCNA.

Similar articles

Cited by

References

    1. Picard B., Gagaoua M. Muscle Fiber Properties in Cattle and Their Relationships with Meat Qualities: An Overview. J. Agric. Food Chem. 2020;68:6021–6039. doi: 10.1021/acs.jafc.0c02086. - DOI - PubMed
    1. Dayton W.R., White M.E. Cellular and molecular regulation of muscle growth and development in meat animals. J. Anim. Sci. 2008;86:217–225. doi: 10.2527/jas.2007-0456. - DOI - PubMed
    1. Asfour H.A., Allouh M.Z., Said R.S. Myogenic regulatory factors: The orchestrators of myogenesis after 30 years of discovery. Exp. Biol. Med. 2018;243:118–128. doi: 10.1177/1535370217749494. - DOI - PMC - PubMed
    1. Fu Y., Shang P., Zhang B., Tian X., Nie R., Zhang R., Zhang H. Function of the Porcine TRPC1 Gene in Myogenesis and Muscle Growth. Cells. 2021;10:147. doi: 10.3390/cells10010147. - DOI - PMC - PubMed
    1. Mohammadabadi M., Bordbar F., Jensen J., Du M., Guo W. Key Genes Regulating Skeletal Muscle Development and Growth in Farm Animals. Animals. 2021;11:835. doi: 10.3390/ani11030835. - DOI - PMC - PubMed

Substances

LinkOut - more resources