. 2024 Feb 23;25(5):2577.
doi: 10.3390/ijms25052577.

Multi-Omics Analysis Reveals That Anthocyanin Degradation and Phytohormone Changes Regulate Red Color Fading in Rapeseed (Brassica napus L.) Petals

Affiliations

Multi-Omics Analysis Reveals That Anthocyanin Degradation and Phytohormone Changes Regulate Red Color Fading in Rapeseed (Brassica napus L.) Petals

Lan Huang et al. Int J Mol Sci. .

Abstract

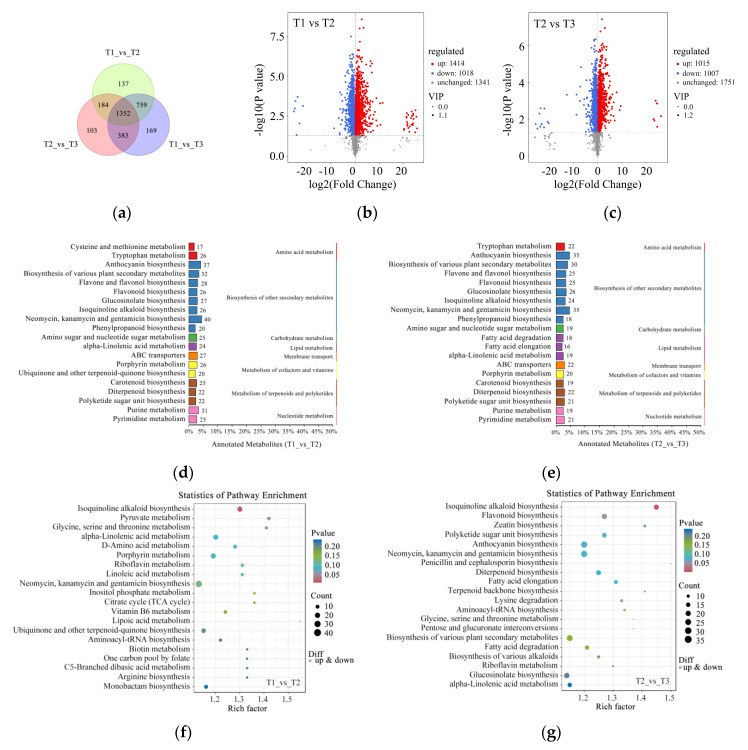
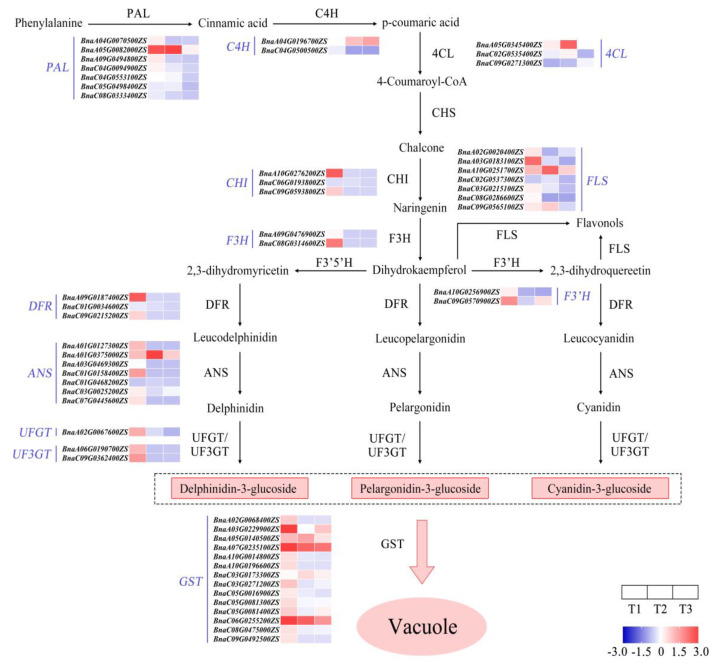
Flower color is an important trait for the ornamental value of colored rapeseed (Brassica napus L.), as the plant is becoming more popular. However, the color fading of red petals of rapeseed is a problem for its utilization. Unfortunately, the mechanism for the process of color fading in rapeseed is unknown. In the current study, a red flower line, Zhehuhong, was used as plant material to analyze the alterations in its morphological and physiological characteristics, including pigment and phytohormone content, 2 d before flowering (T1), at flowering (T2), and 2 d after flowering (T3). Further, metabolomics and transcriptomics analyses were also performed to reveal the molecular regulation of petal fading. The results show that epidermal cells changed from spherical and tightly arranged to totally collapsed from T1 to T3, according to both paraffin section and scanning electron microscope observation. The pH value and all pigment content except flavonoids decreased significantly during petal fading. The anthocyanin content was reduced by 60.3% at T3 compared to T1. The content of three phytohormones, 1-aminocyclopropanecarboxylic acid, melatonin, and salicylic acid, increased significantly by 2.2, 1.1, and 30.3 times, respectively, from T1 to T3. However, auxin, abscisic acid, and jasmonic acid content decreased from T1 to T3. The result of metabolomics analysis shows that the content of six detected anthocyanin components (cyanidin, peonidin, pelargonidin, delphinidin, petunidin, and malvidin) and their derivatives mainly exhibited a decreasing trend, which was in accordance with the trend of decreasing anthocyanin. Transcriptomics analysis showed downregulation of genes involved in flavonol, flavonoid, and anthocyanin biosynthesis. Furthermore, genes regulating anthocyanin biosynthesis were preferentially expressed at early stages, indicating that the degradation of anthocyanin is the main issue during color fading. The corresponding gene-encoding phytohormone biosynthesis and signaling, JASMONATE-ZIM-DOMAIN PROTEIN, was deactivated to repress anthocyanin biosynthesis, resulting in fading petal color. The results clearly suggest that anthocyanin degradation and phytohormone regulation play essential roles in petal color fading in rapeseed, which is a useful insight for the breeding of colored rapeseed.

Keywords: Brassica napus L.; anthocyanin; fading; metabolomics; petal; phytohormone; transcriptomics.


Conflict of interest statement

The authors declare no conflicts of interest.

Figures

Figure 1
Figure 1
Morphological changes of Zhehuhong petal cells 2 d before flowering (T1), at flowering (T2), and 2 d after flowering: (a) under stereomicroscopy; (bd) by paraffin section at 20×, from T1 to T3; (eg) by paraffin section at 40×, from T1 to T3; (hj) by scanning electron microscope at 800×, from T1 to T3; (km) by scanning electronic microscopy at 3000×, from T1 to T3. LE, lower epidermal cell; ST, sponge tissue; UE, upper epidermal cell; VB, vascular bundle.
Figure 2
Figure 2
pH value and pigment content changes during petal color fading in Zhehuhong (T1 to T3): (ag) pH, tannins, proanthocyanidins, flavonoid, carotenoid, total phenols, and anthocyanin, respectively. Different lowercase letters indicate significant differences between treatments using Duncan’s method (p < 0.05). Error bars indicate SD. T1, T2, and T3: 2 d before flowering, at flowering, and 2 d after flowering.
Figure 3
Figure 3
Heatmap of content of 13 phytohormones from T1 to T3. Detected phytohormones included abscisic acid, 1-aminocyclopropanecarboxylic acid, gibberellin A3, indole-3-acetic acid, indole-3-carboxaldehyde, isopentenyl adenosine, jasmonic acid, kinetin, melatonin, methyl indole-3-acetic, methyl jasmonate, salicylic acid, and trans-zeatin-riboside. T1, T2, and T3: 2 d before flowering, flowering, and 2 d after flowering. Darker red indicates higher content while darker yellow indicates lower content.
Figure 4
Figure 4
Metabolomics analysis of petal color fading from T1 to T3: (a) Venn diagram of metabolites at T1, T2, and T3. (b,c) Volcano plots indicating metabolite numbers at T1 vs. T2 and T2 vs. T3. Red dots indicate upregulated metabolites, blue dots indicate downregulated metabolites, and gray dots indicate unchanged metabolites. (d,e) Classification of significantly differentially expressed metabolites at T1 vs. T2 and T2 vs. T3 by KEGG analysis. (f,g) Rich factor analysis of significantly differentially expressed metabolites at T1 vs. T2 and T2 vs. T3. Dots indicate significantly differentially expressed metabolites, size of dots indicates metabolite counts, and color of dots indicates p-value. T1, T2, and T3: 2 d before flowering, flowering, and 2 d after flowering.
Figure 5
Figure 5
Heatmaps of content of six anthocyanins ((a) cyanindin, (b) delphinidin, (c) pelargonidin, (d) malvidin, (e) peonidin, and (f) petunidin) and their derivatives from T1 to T3. T1, T2, and T3: 2 d before flowering, flowering, and 2 d after flowering. aDarker red indicates higher content; darker yellow indicates lower content.
Figure 6
Figure 6
Transcriptomics analysis of petal color fading from T1 to T3: (a) Venn diagram of genes detected at T1, T2, and T3. (b,c) Volcano plots indicating gene numbers at T1 vs. T2 and T2 vs. T3. Red dots indicate upregulated genes, blue dots indicate downregulated genes, and gray dots indicate unchanged genes. (d,e) Rich factor analysis of significantly differentially expressed genes at T1 vs. T2 and T2 vs. T3. Dots indicate significantly differentially expressed metabolites, size of dots indicates metabolite counts, and color of dots indicates p-value. (f) Correlation analysis of selected genes between results of quantitative polymerase chain reaction (qPCR) and transcriptomics analysis. T1, T2, and T3: 2 d before flowering, flowering, and 2 d after flowering.
Figure 7
Figure 7
Outline of gene expression analysis of anthocyanin biosynthesis during petal color fading from T1 to T3. T1, T2, and T3: 2 d before flowering, flowering, and 2 d after flowering. Darker red indicates higher content; darker blue indicates lower content. ANS, anthocyanin synthase; C4H, cinnamate 4 hydroxylase; CHI, chalcone isomerase; CHS, chalcone synthase; 4CL, 4-coumaryl:CoA ligase; DFR, dihydroflavonol 4-reductase; F3H, flavanone 3-hydroxylase; F3′H, flavanone-3′-hydroxylase; F3′5′H, flavanone 3′5′-hydroxylase; FLS, flavonol synthase; GST, glutathione S-transferase; PAL, phenylalanine ammonia lyase; UFGT, flavonoid3-O-glucosyltransferase.
Figure 8
Figure 8
Heatmaps of expression levels of genes encoding phytohormones from T1 to T3. T1, T2, and T3: 2 d before flowering, flowering, and 2 d after flowering. Darker red indicates higher content; darker yellow indicates lower content. ABA, abscisic acid; CTK, cytokinin; ETH, ethylene; GA, gibberellin; IAA, indole-3-acetic acid; JA, jasmonic acid; MT, melatonin; SA, salicylic acid.
Figure 9
Figure 9
Correlation analysis of (a) metabolites and their corresponding genes and (b) phytohormones and their corresponding genes. Large solid colored circles indicate different metabolites or phytohormones, small solid gray-blue circles indicate their corresponding genes. Lines between large and small solid circles indicate positive correlations. Data were selected based on p < 0.05 and correlation coefficient more than 0.9.
Figure 9
Figure 9
Correlation analysis of (a) metabolites and their corresponding genes and (b) phytohormones and their corresponding genes. Large solid colored circles indicate different metabolites or phytohormones, small solid gray-blue circles indicate their corresponding genes. Lines between large and small solid circles indicate positive correlations. Data were selected based on p < 0.05 and correlation coefficient more than 0.9.

References

    1. Fu D.H., Jiang L.Y., Mason A.S., Xiao M.L., Zhu L.R., Li L.Z., Zhou Q.H., Shen C.J., Huang C.H. Research progress and strategies for multifunctional rapeseed: A case study of China. J. Integr. Agric. 2016;15:1673–1684. doi: 10.1016/S2095-3119(16)61384-9. - DOI
    1. Fu W.Q., Chen D.Z., Pan Q., Li F.F., Zhao Z.G., Ge X.H., Li Z.Y. Production of red-flowered oilseed rape via the ectopic expression of Orychophragmus violaceus OvPAP2. Plant Biotechnol. J. 2018;16:367–380. doi: 10.1111/pbi.12777. - DOI - PMC - PubMed
    1. Liu Y.J., Ye S.H., Yuan G.G., Ma X.W., Heng S.P., Yi B., Ma C.Z., Shen J.X., Tu J.X., Fu T.D., et al. Gene silencing of BnaA09.ZEP and BnaC09.ZEP confers orange color in Brassica napus flowers. Plant J. 2020;104:932–949. doi: 10.1111/tpj.14970. - DOI - PubMed
    1. Li S.J., Li X., Wang X.D., Chang T., Peng Z.C., Guan C.Y., Guan M. Flavonoid Synthesis-Related Genes Determine the Color of Flower Petals in Brassica napus L. Int. J. Mol. Sci. 2023;24:6472. doi: 10.3390/ijms24076472. - DOI - PMC - PubMed
    1. Yin N.W., Wang S.X., Jia L.D., Zhu M.C., Yang J., Zhou B.J., Yin J.M., Lu K., Wang R., Li J.N., et al. Identification and Characterization of Major Constituents in Different-Colored Rapeseed Petals by UPLC-HESI-MS/MS. Agric. Food Chem. 2019;67:11053–11065. doi: 10.1021/acs.jafc.9b05046. - DOI - PubMed

LinkOut - more resources