. 2024 Feb 23;25(5):2613.
doi: 10.3390/ijms25052613.

Oxytocin Modifies the Excitability and the Action Potential Shape of the Hippocampal CA1 GABAergic Interneurons

Affiliations

Oxytocin Modifies the Excitability and the Action Potential Shape of the Hippocampal CA1 GABAergic Interneurons

Antonio Nicolas Castagno et al. Int J Mol Sci. .

Abstract

Oxytocin (OT) is a neuropeptide that modulates social-related behavior and cognition in the central nervous system of mammals. In the CA1 area of the hippocampus, the indirect effects of the OT on the pyramidal neurons and their role in information processing have been elucidated. However, limited data are available concerning the direct modulation exerted by OT on the CA1 interneurons (INs) expressing the oxytocin receptor (OTR). Here, we demonstrated that TGOT (Thr4,Gly7-oxytocin), a selective OTR agonist, affects not only the membrane potential and the firing frequency but also the neuronal excitability and the shape of the action potentials (APs) of these INs in mice. Furthermore, we constructed linear mixed-effects models (LMMs) to unravel the dependencies between the AP parameters and the firing frequency, also considering how TGOT can interact with them to strengthen or weaken these influences. Our analyses indicate that OT regulates the functionality of the CA1 GABAergic INs through different and independent mechanisms. Specifically, the increase in neuronal firing rate can be attributed to the depolarizing effect on the membrane potential and the related enhancement in cellular excitability by the peptide. In contrast, the significant changes in the AP shape are directly linked to oxytocinergic modulation. Importantly, these alterations in AP shape are not associated with the TGOT-induced increase in neuronal firing rate, being themselves critical for signal processing.

Keywords: CA1; GABAergic interneurons; electrophysiology; hippocampus; linear mixed-effects models; oxytocin; patch-clamp; phase plot analysis.


Conflict of interest statement

The authors declare no conflicts of interest.

Figures

Figure 1
Figure 1
TGOT depolarizes the membrane potential and increases the firing rate of the OTR-expressing CA1 GABAergic INs. (A) Confocal images showing the GFP+ cells (green); the recorded IN marked with Alexa Fluor 568-conjugated streptavidin labeling of biocytin (red); all the cell nuclei marked with DAPI (blue); the colocalization of GFP (green), Alexa Fluor 568-conjugated streptavidin used to label biocytin (red), and DAPI (blue) that allowed confirmation of the location in the stratum pyramidale of the CA1 hippocampal region and the GABAergic identity of the recorded cell. (B) Representative voltage trace at spike threshold, showing the response of an OTR-expressing CA1 GABAergic IN to the administration of 1 µM TGOT (red bar). The insets show the magnification of representative 10 s long control (blue) and TGOT (red) tracts of the trace. (C,D) All-point plots together with summary statistics (mean ± SEM) showing the depolarization (C) and the increase in the spike frequency (D) induced by TGOT (N = 24 cells from 18 mice; one-sample t-test, *** p < 0.001).
Figure 2
Figure 2
TGOT enhances the excitability of the OTR-expressing CA1 GABAergic INs. (A) Representative voltage traces recorded from an OTR-expressing CA1 GABAergic IN in response to the injection of depolarizing current steps of increasing amplitude (140, 160, and 180 pA) starting from –70 mV. Traces recorded in control (CTRL) are in blue, and traces recorded in TGOT (TGOT) are in red. Notice the higher number of action potentials in TGOT compared to CTRL at all current injections. (B) Firing-rate-to-injected current (F–I) relationships referred to the traces of (A) in CTRL (blue) and TGOT (red), fitted with linear regression functions. (C,D) All-point plots together with summary statistics (mean ± SEM) comparing the values of the offset (C) and the gain (D) obtained from the F–I relationships in CTRL and TGOT (N = 8 cells from 5 mice; paired t-test, * p < 0.05).
Figure 3
Figure 3
TGOT modifies the shape of the APs of the CA1 INs directly modulated by it. (A) Representative AP waveforms in CTRL (blue) and TGOT (red) overlapped to show the variations (magnified in the insets) in the threshold, amplitude, afterhyperpolarization, and kinetics induced by TGOT. (B) Phase–plane plots of the APs shown in (A). (C,E) All-point plots together with summary statistics (mean ± SEM) comparing the values of Vthr, Amp, VAHP (C), dV/dtmax and dV/dtmin (D), and Dur (E) in CTRL and TGOT (N = 17 cells from 12 mice; paired t-test, ** p < 0.01; *** p < 0.001). (F) All-point plot together with summary statistics (mean ± SEM) comparing the values of ISI in CTRL and TGOT (N = 17 cells from 12 mice; paired t-test, ** p < 0.01; *** p < 0.001). (G) Net ionic current estimated from the AP waveforms in (A) in CTRL (blue) and TGOT (red). Notice the reduction in both the inward current and the outward current in TGOT. (H,I) All-point plots together with summary statistics (mean ± SEM) comparing the amplitude (H) and the integral (I) of the inward and the outward currents during the APs in CTRL and TGOT (N = 17 cells from 12 mice; paired t-test, ** p < 0.01; *** p < 0.001).
Figure 4
Figure 4
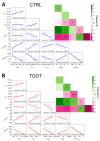
Many AP parameters correlated between each other in the analyzed CA1 GABAergic INs, and these correlations strengthened in the presence of TGOT. (A) In control conditions, pairwise scatterplot matrices, interpolated with regression lines, together with Pearson correlation coefficients for Vthr (mV), VAHP (mV), Amp (mV), dV/dtmin (mV/ms), dV/dtmax (mV/ms), and Dur (ms) (N = 17 cells from 12 mice). The same matrices overlaid on the corresponding color-coded correlation matrices together with the significance value associated with each scatterplot (* p < 0.05; ** p < 0.01; *** p < 0.001) are also reported. (B) Same as (A) for data obtained during TGOT perfusion.
Figure 5
Figure 5
LMMs indicate that TGOT interacts with most of the considered AP parameters to strengthen their influence on each other. (AD) The graphs help to visualize the constructed LMMs used to study the effects and interaction of TGOT and dV/dtmax on Amp (A), TGOT and dV/dtmin on VAHP (B), TGOT and dV/dtmax and Dur (C), and TGOT and dV/dtmin on Dur (D). Each symbol is related to a specific cell (N = 17 cells from 12 mice), and the blue and red colors refer to the CTRL and TGOT conditions, respectively. The dashed line represents the interpolation predicted by the LMM, while the continuous line is the real interpolation for each cell in each experimental condition. The gray area indicates the 95% confidence interval. The vertical dashed line at x = 0 (which corresponds to the mean of the independent variable computed in CTRL condition) illustrates the ordinate axis used by the model. On the right of each graph, an enlargement of a representative cell is shown. The change in the slope of the dashed line in TGOT with respect to CTRL represents the effect of the interaction between TGOT and the considered AP parameters on the dependent variable.
Figure 6
Figure 6
No significant interaction between TGOT and AP parameters existed to determine the ISI reduction during TGOT perfusion. (AF) The graphs help to visualize the constructed LMMs used to study the effects and interaction of TGOT and Amp on ISI (A), TGOT and VAHP on ISI (B), TGOT and Dur on ISI (C), TGOT and dV/dtmax on ISI (D), TGOT and dV/dtmin on ISI (E), and TGOT and Vthr on ISI (F). Each symbol is related to a specific cell (N = 17 cells from 12 mice), and the blue and red colors refer to the CTRL and TGOT conditions, respectively. The dashed line represents the interpolation predicted by the LMM, while the continuous line is the real interpolation for each cell in each experimental condition. The gray area indicates the 95% confidence interval. The vertical dashed line at x = 0 (which correspond to the mean of the independent variable computed in CTRL condition) illustrates the ordinate axis used by the model.
Figure 6
Figure 6
No significant interaction between TGOT and AP parameters existed to determine the ISI reduction during TGOT perfusion. (AF) The graphs help to visualize the constructed LMMs used to study the effects and interaction of TGOT and Amp on ISI (A), TGOT and VAHP on ISI (B), TGOT and Dur on ISI (C), TGOT and dV/dtmax on ISI (D), TGOT and dV/dtmin on ISI (E), and TGOT and Vthr on ISI (F). Each symbol is related to a specific cell (N = 17 cells from 12 mice), and the blue and red colors refer to the CTRL and TGOT conditions, respectively. The dashed line represents the interpolation predicted by the LMM, while the continuous line is the real interpolation for each cell in each experimental condition. The gray area indicates the 95% confidence interval. The vertical dashed line at x = 0 (which correspond to the mean of the independent variable computed in CTRL condition) illustrates the ordinate axis used by the model.
Figure 7
Figure 7
In the absence of membrane depolarization, TGOT modifies the shape of the APs but not the firing rate of the CA1 INs directly modulated by it. (A) Representative voltage trace at a constant spike threshold level showing the response of an OTR-expressing CA1 GABAergic IN to the administration of 1 µM TGOT (red bar). (B,C) All-point plots together with summary statistics (mean ± SEM) showing the absence of depolarization (B) and no increase in the spike frequency (C) induced by TGOT (N = 5 cells from 4 mice; one-sample t-test, p > 0.05). (D) Phase–plane plots of two representative APs in CTRL (blue) and TGOT (red). (EG) All-point plots together with summary statistics (mean ± SEM) comparing the values of the Vthr, Amp, VAHP (E), dV/dtmax and dV/dtmin (F), and Dur (G) in CTRL and TGOT (N = 5 cells from 4 mice; paired t-test, * p < 0.05; ** p < 0.01).

Similar articles

Cited by

References

    1. Swanson L.W., Sawchenko P.E. Hypothalamic integration: Organization of the paraventricular and supraoptic nuclei. Annu. Rev. Neurosci. 1983;6:269–324. doi: 10.1146/annurev.ne.06.030183.001413. - DOI - PubMed
    1. Brown C.H., Ludwig M., Tasker J.G., Stern J.E. Somato-dendritic vasopressin and oxytocin secretion in endocrine and autonomic regulation. J. Neuroendocr. 2020;32:e12856. doi: 10.1111/jne.12856. - DOI - PMC - PubMed
    1. Stoop R. Neuromodulation by oxytocin and vasopressin. Neuron. 2012;76:142–159. doi: 10.1016/j.neuron.2012.09.025. - DOI - PubMed
    1. Mitre M., Minder J., Morina E.X., Chao M.V., Froemke R.C. Oxytocin Modulation of Neural Circuits. Curr. Top. Behav. Neurosci. 2018;35:31–53. - PMC - PubMed
    1. Son S., Manjila S.B., Newmaster K.T., Wu Y.-T., Vanselow D.J., Ciarletta M., Anthony T.E., Cheng K.C., Kim Y. Whole-Brain Wiring Diagram of Oxytocin System in Adult Mice. J. Neurosci. 2022;42:5021–5033. doi: 10.1523/JNEUROSCI.0307-22.2022. - DOI - PMC - PubMed

LinkOut - more resources