Caffeic Acid O-Methyltransferase Gene Family in Mango (Mangifera indica L.) with Transcriptional Analysis under Biotic and Abiotic Stresses and the Role of MiCOMT1 in Salt Tolerance
- PMID: 38473886
- PMCID: PMC10931984
- DOI: 10.3390/ijms25052639
Caffeic Acid O-Methyltransferase Gene Family in Mango (Mangifera indica L.) with Transcriptional Analysis under Biotic and Abiotic Stresses and the Role of MiCOMT1 in Salt Tolerance
Abstract
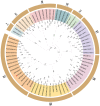
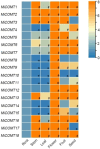
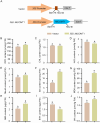
Caffeic acid O-methyltransferase (COMT) participates in various physiological activities in plants, such as positive responses to abiotic stresses and the signal transduction of phytohormones. In this study, 18 COMT genes were identified in the chromosome-level reference genome of mango, named MiCOMTs. A phylogenetic tree containing nine groups (I-IX) was constructed based on the amino acid sequences of the 71 COMT proteins from seven species. The phylogenetic tree indicated that the members of the MiCOMTs could be divided into four groups. Quantitative real-time PCR showed that all MiCOMT genes have particularly high expression levels during flowering. The expression levels of MiCOMTs were different under abiotic and biotic stresses, including salt and stimulated drought stresses, ABA and SA treatment, as well as Xanthomonas campestris pv. mangiferaeindicae and Colletotrichum gloeosporioides infection, respectively. Among them, the expression level of MiCOMT1 was significantly up-regulated at 6-72 h after salt and stimulated drought stresses. The results of gene function analysis via the transient overexpression of the MiCOMT1 gene in Nicotiana benthamiana showed that the MiCOMT1 gene can promote the accumulation of ABA and MeJA, and improve the salt tolerance of mango. These results are beneficial to future researchers aiming to understand the biological functions and molecular mechanisms of MiCOMT genes.
Keywords: COMT gene family; salt tolerance; transcriptional analysis; transient overexpression.
Conflict of interest statement
The authors declare no conflicts of interest.
Figures


Similar articles
-
Genome-Wide Characterization, Identification and Expression Profile of MYB Transcription Factor Gene Family during Abiotic and Biotic Stresses in Mango (Mangifera indica).Plants (Basel). 2022 Nov 16;11(22):3141. doi: 10.3390/plants11223141. Plants (Basel). 2022. PMID: 36432870 Free PMC article.
-
CONSTANS-like 13 homologs MiCOL13 A and MiCOL13B orchestrate flowering time and salt-drought tolerance in mango.Planta. 2025 May 11;261(6):136. doi: 10.1007/s00425-025-04711-3. Planta. 2025. PMID: 40349254
-
GhWRKY25, a group I WRKY gene from cotton, confers differential tolerance to abiotic and biotic stresses in transgenic Nicotiana benthamiana.Protoplasma. 2016 Sep;253(5):1265-81. doi: 10.1007/s00709-015-0885-3. Epub 2015 Sep 26. Protoplasma. 2016. PMID: 26410829
-
Functional identification of mango MiGID1A and MiGID1B genes confers early flowering and stress tolerance.Plant Sci. 2025 Jun;355:112468. doi: 10.1016/j.plantsci.2025.112468. Epub 2025 Mar 10. Plant Sci. 2025. PMID: 40074202
-
Genomic analysis of WD40 protein family in the mango reveals a TTG1 protein enhances root growth and abiotic tolerance in Arabidopsis.Sci Rep. 2021 Jan 26;11(1):2266. doi: 10.1038/s41598-021-81969-z. Sci Rep. 2021. PMID: 33500544 Free PMC article.
Cited by
-
Transcriptomics-proteomics analysis reveals StCOMT1 regulates drought, alkali and combined stresses in potato.Plant Cell Rep. 2025 Apr 29;44(5):109. doi: 10.1007/s00299-025-03496-9. Plant Cell Rep. 2025. PMID: 40299051
-
Caffeic acid O-methyltransferase from Ligusticum chuanxiong alleviates drought stress, and improves lignin and melatonin biosynthesis.Front Plant Sci. 2024 Sep 18;15:1458296. doi: 10.3389/fpls.2024.1458296. eCollection 2024. Front Plant Sci. 2024. PMID: 39359625 Free PMC article.
-
Molecular signatures that translate across omics layers and crops under high aluminium and low phosphorus stress facilitate the identification of reliable molecular targets for genotyping in lentil.Funct Integr Genomics. 2025 Mar 5;25(1):52. doi: 10.1007/s10142-025-01542-z. Funct Integr Genomics. 2025. PMID: 40042647
References
-
- Lu N., Ma W., Han D., Liu Y., Wang Z., Wang N., Yang G., Qu G., Wang Q., Zhao K., et al. Genome-wide analysis of the Catalpa bungei Caffeic acid O-methyltransferase (COMT) gene family: Identification and expression profiles in normal, tension, and opposite wood. PeerJ. 2019;7:e6520. doi: 10.7717/peerj.6520. - DOI - PMC - PubMed
-
- Chen S., Zhao Y., Zhao X., Chen S. Identification of putative lignin biosynthesis genes in Betula pendula. Trees. 2020;34:1255–1265. doi: 10.1007/s00468-020-01995-8. - DOI
MeSH terms
Substances
Grants and funding
- grant number 2021YFD1600805/the National Key R&D Program of China
- grant numbers GKLBM02201/the Open Project of Guangxi Key Laboratory of Biology for Mango
- grant numbers 16300320220007/the Central Public-Interest Scientific Institution Basal Research Fund for Chinese Academy of Tropical Agricultural Sciences
- grant number CARS-31/the earmarked fund for CARS
- grant numbers KLBSTCHN2022-3/the Open Project of Key Laboratory of Biotechnology of Salt Tolerant Crops of Hainan Province
LinkOut - more resources
Full Text Sources
Miscellaneous

