. 2024 Feb 26;25(5):2672.
doi: 10.3390/ijms25052672.

The Microtubule End Binding Protein Mal3 Is Essential for the Dynamic Assembly of Microtubules during Magnaporthe oryzae Growth and Pathogenesis

Affiliations

The Microtubule End Binding Protein Mal3 Is Essential for the Dynamic Assembly of Microtubules during Magnaporthe oryzae Growth and Pathogenesis

Ningning Shen et al. Int J Mol Sci. .

Abstract

Cytoskeletal microtubules (MTs) play crucial roles in many aspects of life processes in eukaryotic organisms. They dynamically assemble physiologically important MT arrays under different cell conditions. Currently, aspects of MT assembly underlying the development and pathogenesis of the model plant pathogenic fungus Magnaporthe oryzae (M. oryzae) are unclear. In this study, we characterized the MT plus end binding protein MoMal3 in M. oryzae. We found that knockout of MoMal3 results in defects in hyphal polar growth, appressorium-mediated host penetration and nucleus division. Using high-resolution live-cell imaging, we further found that the MoMal3 mutant assembled a rigid MT in parallel with the MT during hyphal polar growth, the cage-like network in the appressorium and the stick-like spindle in nuclear division. These aberrant MT organization patterns in the MoMal3 mutant impaired actin-based cell growth and host infection. Taken together, these findings showed that M. oryzae relies on MoMal3 to assemble elaborate MT arrays for growth and infection. The results also revealed the assembly mode of MTs in M. oryzae, indicating that MTs are pivotal for M. oryzae growth and host infection and may be new targets for devastating fungus control.

Keywords: Magnaporthe oryzae; dynamic assembly; infection mechanism; microtubule cytoskeleton; microtubule plus end; nucleus division; rice blast.


Conflict of interest statement

The authors declare no conflicts of interest.

Figures
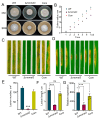
Figure 1
Figure 1
Growth and plant infection defects of the MoMal3 mutant. (A) Seven-day-old cultures of the WT, Δmomal3, and complemented strain (Com) strains on CM and SRB media. (B) The graphs indicate the hyphal growth rate of the WT, Δmomal3 and complemented strains. The colony diameters on CM plates were measured 7 days after inoculation. The error bars indicate the SDs calculated for three replicates. (C,D) Pathogenicity assay of the WT, Δmomal3, and complemented strains via whole-plant spray (C) and punch inoculation (D) assays. Conidia (105 spores/mL) from the WT, Δmomal3 and complemented strains were sprayed onto or removed from the punctured rice leaves (O. sativa cv. Nipponbare). Photographs were taken 6 days after infection. (E,F) Quantification of the lesion number per cm2 (E) and lesion area (F) of the rice leaves from the rice leaves shown in (C,D). The error bars represent SDs (n = 20), and the asterisks (***) represent significant differences (p < 0.001), ns: no significant difference. (G) Relative fungal counts of the M. oryzae Pot2 gene compared to those of the rice ubiquitin gene determined by qPCR. The data represent the mean and standard deviation of three biological replicates. Three technical replicates were performed for each biological sample. Asterisks represent significant differences (*** p < 0.001, Student’s t test), ns: no significant difference.
Figure 2
Figure 2
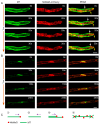
Localization of MoMal3 in M. oryzae. (A) Expression of pMoMal3-MoMal3-mCherry in β-tubulin-GFP-labelled Δmomal3 vegetative hyphae. The numbers at the top right corner indicate the timestamps (S). The white and yellow arrows indicate that MoMal3 guides +tip MT polymerization along an existing MT to form MT bundles and typical single MT +tip elongation, respectively. The purple arrow indicates that MoMal3-mCherry does not localize to the depolymerized MT+ tip. The corresponding movie is provided as Supplemental Movie S2. Bars = 5 μm. (B) MoMal3-mCherry localized to a developing MT spindle. The corresponding movie is provided as Supplemental Movie S3. Bars = 5 μm. (C) Subcellular localization pattern of MoMal3 in M. oryzae shown in (A,B). ①–④ indicates the four MoMal3 localization patterns. And the purple arrows indicate the growing direction of MT.
Figure 3
Figure 3
Microtubule organization in the WT and Δmomal3 hyphae. (A,B) Representative time-lapse images showing the MT dynamics in growing WT (A) and Δmomal3 (B) hyphae. Thirty cells were observed for both the WT and Δmomal3 strains, and similar observations were made. The corresponding movie is provided as Supplemental Movies S4 and S5. The red arrows indicate single MT elongation events, and the yellow arrows indicate a growing MT along an existing MT bundle to form an MT bundle. The purple dashed arrows indicate the elongated MT at the same time period. Bars = 5 μm. (CH) Statistical analysis of the number of single MTs: (C) MT bundle formation; (D) branched MT formation; (E) MT depolymerization at the +tip end; (F) single MT elongation rate; (G) and single MT depolymerization rate in the growing hyphae of the WT and Δmomal3 strains, provided in Supplemental Movies S4 and S5. The green arrows indicate the MT assembly direction and pattern. And the dash line in (F) indicates the depolymerization of MT at the MT (+) plus end. The error bars represent SDs (n = 50), and the asterisks (**) represent significant differences (p < 0.01). (I) A proposed model showing the organization of the MT at the hyphal tip. Arrows indicate the MT assembly direction.
Figure 4
Figure 4
Defects in vesicle polar trafficking and actin organization in Δmomal3. (A) Representative images showing FM4-64-stained hyphae of the WT and Δmomal3 strains. Bars = 5 μm. Thirty cells were observed for both the WT and Δmomal3 strains, and similar observations were made. (B) Line-scan analysis of FM4-64 aggregation at the hyphal tip region ① shown in (A). (C) Analysis of protein secretion in the Δmomal3 strain. The error bars show the means ± SDs of three biological repetitions of the experiment. Asterisks indicate statistically significant differences according to Student’s t test (**, p < 0.01). (D) Actin organization in the WT and Δmomal3 growing hyphae. The arrows indicate actin at the Spk. The corresponding movie is provided as Supplemental Movie S6. Bars = 5 μm. Fifty WT and Δmomal3 cells were observed, and similar observations were made. (E) Line-scan analysis of actin at the Spk at the hyphal tip region ② shown in (D). (F) Distribution of the GFP-labelled v-SNARE protein Snc1 in the hyphae of the WT and Δmomal3 plants. The arrowheads indicate Snc1-GFP distributed at the hyphal tip. The corresponding movie is provided as Supplemental Movie S7. Bars = 5 μm. Fifty WT and Δmomal3 cells were observed, and similar observations were made. (G) Line-scan analysis of Snc1-GFP distributed at the hyphal tip region ③ shown in (F).
Figure 5
Figure 5
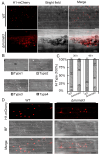
Penetration analysis of Δmomal3. (A) Rice leaf sheath cells were inoculated with H1-mCherry-labelled WT or Δmomal3 M. oryzae spores. Photographs were taken 72 h after infection. Scale bars = 5 µm. (B) Growth of invasive hyphae (IH) on rice sheath cells. Four typical types of IH were quantified and statistically analyzed for both the WT and Δmomal3 strains at 36 h and 48 h after infection (C). The error bars represent the SDs; n ≥ 50 cells. Bar = 20 μm. (D) Representative images showing the infection process of WT or Δmomal3 at 48 h after infection. WT IHs spread to neighboring rice cells, and Δmomal3 IHs still proliferated in the primary infected cells. Bars = 20 µm.
Figure 6
Figure 6
Microtubule organization in the WT and Δmomal3 appressoria. (A) Maximum projection of Z-slices obtained by imaging an 8 h developed appressorium of the WT and Δmomal3 strains illustrating the structure of the MT cytoskeleton. Thirty cells were observed for both the WT and Δmomal3 strains. A 3D movie generated from these slices showing the spatial structure of the MT cytoskeleton in the appressorium. The corresponding movie is provided as Supplemental Movie S8. Bars = 10 μm. (B) Time-lapse images showing the MT dynamics in an 8 h developed appressorium of the WT and Δmomal3 strains. Fifty WT and Δmomal3 cells were observed, and similar observations were made. The corresponding movies are provided as Supplemental Movies S9 and S10. The red arrows indicate MT elongation events. ①–③ indicates the elongated MT at the same time period.The numbers at the top right corner indicate the timestamps (S). Bars = 10 μm. (CG) Statistical analysis of the number of single MT polymerization events (C), MT bundle formation (D), MT depolymerization at the +tip end (E), branched MT formation (F) and the single MT elongation rate (G) in the appressorium of the WT and Δmomal3 strains in Supplemental Movies S9 and S10. The green arrows indicate the MT assembly direction and pattern. And the dash line in (E) indicates the depolymerization of MT at the MT (+) plus end. The error bars represent SDs (n = 100), and the asterisks (**) represent significant differences (p < 0.01). (H) A proposed model showing the organization of the MT at the appressorium. Arrows indicate the MT assembly direction.
Figure 7
Figure 7
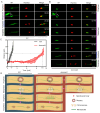
MT spindle and nucleus division in the hyphae of the WT and Δmomal3 strains. (A,B) Time-lapse images showing the MT dynamics and nuclear division in the hyphae of the WT (A) and Δmomal3 (B) strains. Thirty cells were observed for both the WT and Δmomal3 strains, and similar observations were made. Histone1-mCherry was expressed in the MT-labelled WT and Δmomal3 strains. The four mitosis stages are shown in the figure for both the WT and the Δmomal3 strains. The numbers at the top right corner indicate the timestamps (Min:Sec). The corresponding movie is Supplemental Movie S11. Bars = 5 μm. The white arrows indicate the enlarged spindle. (C) Normalized curve showing the chromosomal distance in mitosis shown in (A,B). (D) A diagram showing the development of the MT spindle related to the division of the chromosomes in the WT and Δmomal3 strains. Pink arrows indicate the mitotic progressions.
Figure 8
Figure 8
Nucleus division and transfer to neighboring cells during WT and Δmomal3 infection. (A,B) Timelapse images showing the MT dynamics and nuclear division in the invasive hyphae of the WT (A) and Δmomal3 (B) strains. Twenty-five cells were observed for both the WT and Δmomal3 strains, and similar observations were made. Histone1-mCherry was expressed in the MT-labelled WT and Δmomal3 strains. The four mitosis stages are shown in the figure for both the WT and the Δmomal3 strains. In the prophase of the WT plants, the nucleus was arranged close to the plant cell wall. In addition, during metaphase, the M. oryzae MT spindle crosses the plant cell wall and begins to draw chromosomes into neighboring plant cells. However, in the Δmomal3 strain, the time required for the MT spindle to cross the plant cell wall was longer. The numbers at the top right corner indicate the timestamps (Min:Sec). The corresponding movie is provided as Supplemental Movie S12. Bars = 2 μm. ① means the primary infected cell and ② means the neighbouring infected cell. (C) Normalized curve showing the chromosome distance in mitosis shown in (A,B).

Similar articles

References

    1. Dean R., Van Kan J.A., Pretorius Z.A., Hammond-Kosack K.E., Di Pietro A., Spanu P.D., Rudd J.J., Dickman M., Kahmann R., Ellis J., et al. The Top 10 fungal pathogens in molecular plant pathology. Mol. Plant Pathol. 2012;13:414–430. doi: 10.1111/j.1364-3703.2011.00783.x. - DOI - PMC - PubMed
    1. Talbot N.J. On the trail of a cereal killer: Exploring the biology of Magnaporthe grisea. Annu. Rev. Microbiol. 2003;57:177–202. doi: 10.1146/annurev.micro.57.030502.090957. - DOI - PubMed
    1. Wilson R.A., Talbot N.J. Under pressure: Investigating the biology of plant infection by Magnaporthe oryzae. Nat. Rev. Microbiol. 2009;7:185–195. doi: 10.1038/nrmicro2032. - DOI - PubMed
    1. Fernandez J., Orth K. Rise of a Cereal Killer: The Biology of Magnaporthe oryzae Biotrophic Growth. Trends Microbiol. 2018;26:582–597. doi: 10.1016/j.tim.2017.12.007. - DOI - PMC - PubMed
    1. Eseola A.B., Ryder L.S., Oses-Ruiz M., Findlay K., Yan X., Cruz-Mireles N., Molinari C., Garduno-Rosales M., Talbot N.J. Investigating the cell and developmental biology of plant infection by the rice blast fungus Magnaporthe oryzae. Fungal Genet. Biol. 2021;154:103562. doi: 10.1016/j.fgb.2021.103562. - DOI - PubMed

MeSH terms

Supplementary concepts