. 2024 Feb 26;25(5):2681.
doi: 10.3390/ijms25052681.

MiR-290 Family Maintains Pluripotency and Self-Renewal by Regulating MAPK Signaling Pathway in Intermediate Pluripotent Stem Cells

Affiliations

MiR-290 Family Maintains Pluripotency and Self-Renewal by Regulating MAPK Signaling Pathway in Intermediate Pluripotent Stem Cells

Yueshi Liu et al. Int J Mol Sci. .

Abstract

Mouse embryonic stem cells (ESCs) and epiblast stem cells (EpiSCs) are derived from pre- and post-implantation embryos, representing the initial "naïve" and final "primed" states of pluripotency, respectively. In this study, novel reprogrammed pluripotent stem cells (rPSCs) were induced from mouse EpiSCs using a chemically defined medium containing mouse LIF, BMP4, CHIR99021, XAV939, and SB203580. The rPSCs exhibited domed clones and expressed key pluripotency genes, with both X chromosomes active in female cells. Furthermore, rPSCs differentiated into cells of all three germ layers in vivo through teratoma formation. Regarding epigenetic modifications, the DNA methylation of Oct4, Sox2, and Nanog promoter regions and the mRNA levels of Dnmt3a, Dnmt3b, and Dnmt1 were reduced in rPSCs compared with EpiSCs. However, the miR-290 family was significantly upregulated in rPSCs. After removing SB203580, an inhibitor of the p38 MAPK pathway, the cell colonies changed from domed to flat, with a significant decrease in the expression of pluripotency genes and the miR-290 family. Conversely, overexpression of pri-miR-290 reversed these changes. In addition, Map2k6 was identified as a direct target gene of miR-291b-3p, indicating that the miR-290 family maintains pluripotency and self-renewal in rPSCs by regulating the MAPK signaling pathway.

Keywords: intermediate state; miR-290 family; naïve stem cells; p38 MAPK signaling pathway; pluripotency; primed stem cells.


Conflict of interest statement

The authors declare no conflict of interest.

Figures
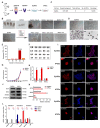
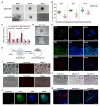
Figure 1
Figure 1
Derivation and characterization of rPSCs. (A) Schematic of the derivation of rPSCs. (B) A bright field image shows the derivation process of rPSCs. Scale bars: 100 µm. (C) Efficiency of rESCs conversed with EpiSCs in rPSCs medium. (D) Alkaline phosphatase (AP) staining on rPSCs and EpiSCs. Scale bars: 100 µm. (E) Distribution of chromosome numbers in rPSCs. (F) Karyotype of rPSCs. XX is two X chromosomes, representing the female cell line. (G) Cell growth curves of rPSCs and EpiSCs. (H) RT-qPCR analysis of pluripotency gene expression in rPSCs, and EpiSCs were used as a control. (I) Immunofluorescence staining of OCT4, SOX2, and NANOG in rPSCs and EpiSCs. Scale bars: 50 µm. (J) Western blot analysis for OCT4, SOX2, and NANOG in rPSCs and EpiSCs. (K) Quantification of OCT4, SOX2, and NANOG protein intensity analysis in rPSCs and EpiSCs. (L) RT-qPCR analysis of endoderm-, mesoderm-, and ectoderm-associated gene expression in rPSCs, EpiSCs, and ESCs. The above experiments included three replications. Error bars are SEM. Significance was tested with two-tailed Student’s t-tests, with * p < 0.05, ** p < 0.01, *** p < 0.001, and ns at p > 0.05.
Figure 2
Figure 2
Differentiated and developmental potencies of rPSCs. (A) Morphology of embryoid body (EB) induction by rPSCs and EpiSCs on Day 2, Day 4, and Day 6. Scale bars: 100 µm. (B) Statistics of the number and diameter of EB formed by rPSCs and EpiSCs. N represents the number of EB spheres. (C) RT-qPCR analysis of endoderm-, mesoderm-, and ectoderm-associated gene expression in the EB of rPSCs and EpiSCs. (D) Adherence differentiation of EB formed by rPSCs and EpiSCs for 7 days. Scale bars: 100 µm. (E) Immunofluorescence staining of three germ layer markers in the EB of rPSCs and EpiSCs. AFP was used to visualize the endoderm, SMA was used to visualize the mesoderm, and GFAP was used to visualize the ectoderm. Scale bars: 50 µm. (F) Mature teratoma from rPSCs. Left: endoderm, gland-like cells. Middle: mesoderm, muscle-like cells. Right: ectoderm, neural-like cells. The sections were stained with H&E. Scale bars: 100 µm. (G) Immunofluorescence staining of three germ layer markers in the teratoma test. GATA6 was used to visualize the endoderm, T was used to visualize the mesoderm, and NESTIN was used to visualize the ectoderm. Scale bars: 50 µm. (H) Schematic of the eight-cell embryo injection protocol. (I) E3.5 chimeras generated by injecting rPSCs into eight-cell embryos and cultured in KSOM for 24 h and 48 h. Scale bars: 100 µm. (J) Immunofluorescence staining of blastocysts at 24 h after injection of rPSCs. OCT4 was used as the ICM marker. Scale bars: 50 µm. The above experiments included three replications. Error bars are SEM. Significance was tested with two-tailed Student’s t-tests, with * p < 0.05 and *** p < 0.001.
Figure 3
Figure 3
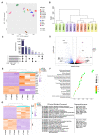
Analyses of molecular features of rPSCs. (A) Principal component analysis (PCA) of transcriptome data from pre-implantation embryos (2-Cell, 8-Cell, E3.5 ICM, and E4.0 ICM), post-implantation (E5.5 EPI and E6.5 EPI), ESCs, EpiSCs, FSCs, and rPSCs. (B) Hierarchical clustering of the transcriptome from three biological replicates (n = 3) of four pluripotent stem cell lines. (C) The UpSet plot shows specific genes in three pluripotent stem cell lines. (D) The volcano plot of differentially expressed genes for rPSCs versus EpiSCs. (E) Heatmap showing scaled expression of pluripotency transcription factors and lineage factors. (F) Kyoto Encyclopedia of Genes and Genomes (KEGG) pathway analysis of DEGs for rPSCs versus EpiSCs described in (D). (G) Heatmap showing differentially expressed genes (fold change of ≥2, adjusted p value < 0.001) in rPSCs (n = 3) compared with EpiSCs (n = 3). Significantly enriched gene ontology (GO) terms and representative genes in each cluster are listed on the right.
Figure 4
Figure 4
Epigenetic changes during the conversion of EpiSCs to rPSCs. (A) Immunofluorescence staining of H3K27me3, H3K4me3, and H3K9me3 in rPSCs and EpiSCs. White arrows point to the bright H3K27me3 foci in female EpiSCs. Scale bars: 50 µm. (B) Western blot analysis for H3K4me3 protein in rPSCs and EpiSCs. (C) Quantification of H3K4me3 protein intensity analysis in rPSCs and EpiSCs. (D) RT-qPCR analysis of Ezh1, Ezh2, and Wdr5 expression in rPSCs and EpiSCs. (E) RT-qPCR analysis of DNA methylation-related gene expression (Dnmt3a, Dnmt3b, Dnmt1, Tet1, and Tet2) in rPSCs, and EpiSCs were used as a control. (F) Changes in DNA methylation of Oct4, Sox2, and Nanog promoter regions during the conversion of EpiSCs to rPSCs. (G) RT-qPCR analysis of mature miRNAs miR-290-3p, miR-291a-3p, miR-291b-3p, miR-292a-3p, miR-294-3p, and miR-295-3p in rPSCs, and EpiSCs were used as a control. (H) Changes in DNA methylation of the miR-290 super enhancer (SE) region in rPSCs and EpiSCs. The above experiments included three replications. Error bars are SEM. Significance was tested with two-tailed Student’s t-tests, with * p < 0.05, ** p < 0.01, and *** p < 0.001.
Figure 5
Figure 5
Removal of SB203580 reduced the pluripotency of rPSCs. (A) Morphological changes and AP staining after rPSCs removal of SB203580. Scale bars: 100 µm. (B) RT-qPCR analysis of mature miRNAs miR-290-3p, miR-291a-3p, miR-291b-3p, miR-292a-3p, miR-294-3p, and miR-295-3p expression in rPSCs and rPSCs(-SB). (C) RT-qPCR analysis of key factors and up-/down-regulating target gene expression of the p38 MAPK signaling pathway in rPSCs and rPSCs(-SB). (D) RT-qPCR analysis of DNA methylation-related gene expression in rPSCs and rPSCs(-SB). (E) Immunofluorescence staining of OCT4, SOX2, and NANOG in rPSCs(-SB). Scale bars: 50 µm. (F) Western blot analysis for OCT4, SOX2, and NANOG in rPSCs and rPSCs(-SB). (G) Quantification of OCT4, SOX2, and NANOG protein intensity analysis in rPSCs and rPSCs(-SB). (H) RT-qPCR analysis of pluripotency-associated gene expression in rPSCs and rPSCs(-SB). (I) RT-qPCR analysis of endoderm, mesoderm, and ectoderm-associated gene expression in rPSCs and rPSCs(-SB). The above experiments included three replications. Error bars are SEM. Significance was tested with two-tailed Student’s t-tests, with * p < 0.05, ** p < 0.01, and *** p < 0.001.
Figure 6
Figure 6
Map2k6 is a direct target of miR-291b-3p. (A) Venn diagram of common targets of miR-291a-3p, miR-291b-3p, miR-294-3p, and miR-295-3p. (B) KEGG analysis showed that common targets were mainly enriched in the PI3K-AKT signaling pathway and the MAPK signaling pathway. (C) Target binding site of miR-291b-3p in the Map2k6 mRNA 3′-UTR. CDS, coding sequence; WT, wild-type seed sequence; MUT, mutant seed sequence. (D) Relative luciferase activity in ESCs co-transfected with miR-291b-3p mimic and Map2k6-3′UTR-WT or Map2k6-3′UTR-MUT luciferase reporter vector. Each experiment included 1 × 10⁶ cells. (E,F) RT-qPCR analysis of the expression levels of Map2k6 mRNA and miR-291b-3p in ESCs after miR-291b-3p mimic transfection. (G) Western blot analysis for MAP2K6 protein level in ESCs after miR-291b-3p mimic transfection. (H) Quantification of MAP2K6 protein intensity analysis in ESCs after miR-291b-3p mimic transfection. (I) RT-qPCR analysis of Map2k3 and Map2k6 expression in rPSCs and rPSCs(-SB). The above experiments included three replications. Error bars are SEM. Significance was tested with two-tailed Student’s t-tests, with ** p < 0.01, *** p < 0.001, and ns at p > 0.05.
Figure 7
Figure 7
Overexpression of pri-miR-290 can improve the pluripotency of rPSCs(-SB). (A) Morphological changes in rPSCs(-SB) after overexpression of pri-miR-290. Scale bars: 100 µm. (B) RT-qPCR was used to detect the overexpression efficiency of pri-miR-290. (C) RT-qPCR analysis of mature miRNAs miR-290-3p, miR-291a-3p, miR-291b-3p, miR-292a-3p, miR-294-3p, and miR-295-3p after overexpression of pri-miR-290. (D) RT-qPCR analysis of pluripotency-associated genes and three germ layer-associated gene expression in three cell lines. (E) Western blot analysis for phosphorylated and total forms of p38 MAPK and ERK in rPSCs, rPSCs(-SB), and the pri-miR-290-pcDNA3.1-EGFP group. (F) Quantification of p38 MAPK, p-p38 MAPK, ERK, and p-ERK protein intensity analysis in rPSCs, rPSCs(-SB), and the pri-miR-290-pcDNA3.1-EGFP group. (G) RT-qPCR analysis of up-/down-regulating target gene expression of the p38 MAPK signaling pathway in rPSCs(-SB) and the pri-miR-290-pcDNA3.1-EGFP group. (H) Morphology of EB induction by the pri-miR-290-pcDNA3.1-EGFP group in Day 2, Day 4, and Day 6. Scale bars: 100 µm. (I) Statistics of the diameter of EB formed by rPSCs and the pri-miR-290-pcDNA3.1-EGFP group. (J) RT-qPCR analysis of endoderm-, mesoderm-, and ectoderm-associated gene expression in rPSCs-EB-D3 and pri-miR-290-pcDNA3.1-EGFP-EB-D3. (K) Mature teratoma from rPSCs. Left: endoderm, gland-like cells. Middle: mesoderm, cartilage-like cells. Right: ectoderm, neural-like cells. The sections were stained with H&E. Scale bars: 100 µm. The above experiments included three replications. Error bars are SEM. Significance was tested with two-tailed Student’s t-tests, with * p < 0.05, ** p < 0.01, *** p < 0.001, and ns at p > 0.05.

Similar articles

References

    1. Hackett J.A., Surani M.A. Regulatory principles of pluripotency: From the ground state up. Cell Stem Cell. 2014;15:416–430. doi: 10.1016/j.stem.2014.09.015. - DOI - PubMed
    1. Weinberger L., Ayyash M., Novershtern N., Hanna J.H. Dynamic stem cell states: Naive to primed pluripotency in rodents and humans. Nat. Rev. Mol. Cell Biol. 2016;17:155–169. doi: 10.1038/nrm.2015.28. - DOI - PubMed
    1. EVANS M.J. Establishment in culture of pluripotential cells from mouse embryos. Nature. 1981;292:154–156. doi: 10.1038/292154a0. - DOI - PubMed
    1. Brons I.G., Smithers L.E., Trotter M.W., Rugg-Gunn P., Sun B., Chuva de Sousa Lopes S.M., Howlett S.K., Clarkson A., Ahrlund-Richter L., Pedersen R.A., et al. Derivation of pluripotent epiblast stem cells from mammalian embryos. Nature. 2007;448:191–195. doi: 10.1038/nature05950. - DOI - PubMed
    1. Nichols J., Smith A. Naive and Primed Pluripotent States. Cell Stem Cell. 2009;4:487–492. doi: 10.1016/j.stem.2009.05.015. - DOI - PubMed