The Prolonged Activation of the p65 Subunit of the NF-Kappa-B Nuclear Factor Sustains the Persistent Effect of Advanced Glycation End Products on Inflammatory Sensitization in Macrophages
- PMID: 38473959
- PMCID: PMC10932021
- DOI: 10.3390/ijms25052713
The Prolonged Activation of the p65 Subunit of the NF-Kappa-B Nuclear Factor Sustains the Persistent Effect of Advanced Glycation End Products on Inflammatory Sensitization in Macrophages
Abstract
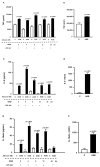
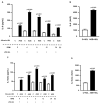
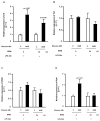
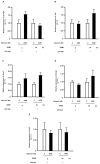
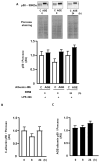
Advanced glycation end products (AGEs) prime macrophages for lipopolysaccharide (LPS)-induced inflammation. We investigated the persistence of cellular AGE-sensitization to LPS, considering the nuclear content of p50 and p65 nuclear factor kappa B (NFKB) subunits and the expression of inflammatory genes. Macrophages treated with control (C) or AGE-albumin were rested for varying intervals in medium alone before being incubated with LPS. Comparisons were made using one-way ANOVA or Student t-test (n = 6). AGE-albumin primed macrophages for increased responsiveness to LPS, resulting in elevated levels of TNF, IL-6, and IL-1beta (1.5%, 9.4%, and 5.6%, respectively), compared to C-albumin. TNF, IL-6, and IL-1 beta secretion persisted for up to 24 h even after the removal of AGE-albumin (area under the curve greater by 1.6, 16, and 5.2 times, respectively). The expressions of Il6 and RelA were higher 8 h after albumin removal, and Il6 and Abca1 were higher 24 h after albumin removal. The nuclear content of p50 remained similar, but p65 showed a sustained increase (2.9 times) for up to 24 h in AGE-albumin-treated cells. The prolonged activation of the p65 subunit of NFKB contributes to the persistent effect of AGEs on macrophage inflammatory priming, which could be targeted for therapies to prevent complications based on the AGE-RAGE-NFKB axis.
Keywords: NFKB; RAGE; advanced glycation end products; inflammation; lipopolysaccharide; toll-like receptor.
Conflict of interest statement
The authors declare no conflicts of interest.
Figures


Similar articles
-
Nuclear Factor-Kappa-B Mediates the Advanced Glycation End Product-Induced Repression of Slc2a4 Gene Expression in 3T3-L1 Adipocytes.Int J Mol Sci. 2024 Jul 28;25(15):8242. doi: 10.3390/ijms25158242. Int J Mol Sci. 2024. PMID: 39125811 Free PMC article.
-
RAGE-TLR4 Crosstalk Is the Key Mechanism by Which High Glucose Enhances the Lipopolysaccharide-Induced Inflammatory Response in Primary Bovine Alveolar Macrophages.Int J Mol Sci. 2023 Apr 10;24(8):7007. doi: 10.3390/ijms24087007. Int J Mol Sci. 2023. PMID: 37108174 Free PMC article.
-
Inhibitory effect of chroman carboxamide on interleukin-6 expression in response to lipopolysaccharide by preventing nuclear factor-kappaB activation in macrophages.Eur J Pharmacol. 2006 Aug 14;543(1-3):158-65. doi: 10.1016/j.ejphar.2006.05.042. Epub 2006 Jun 2. Eur J Pharmacol. 2006. PMID: 16797005
-
Advanced glycation end-product 2 and Porphyromonas gingivalis lipopolysaccharide increase sclerostin expression in mouse osteocyte-like cells.Bone. 2019 May;122:22-30. doi: 10.1016/j.bone.2019.02.001. Epub 2019 Feb 5. Bone. 2019. PMID: 30735798
-
Glycated albumin produced in diabetic hyperglycemia promotes monocyte secretion of inflammatory cytokines and bacterial adherence to epithelial cells.J Periodontal Res. 2015 Apr;50(2):197-204. doi: 10.1111/jre.12194. Epub 2014 May 12. J Periodontal Res. 2015. PMID: 24815722
Cited by
-
The role of SLC7A11 in diabetic wound healing: novel insights and new therapeutic strategies.Front Immunol. 2024 Sep 3;15:1467531. doi: 10.3389/fimmu.2024.1467531. eCollection 2024. Front Immunol. 2024. PMID: 39290692 Free PMC article. Review.
-
Nuclear Factor-Kappa-B Mediates the Advanced Glycation End Product-Induced Repression of Slc2a4 Gene Expression in 3T3-L1 Adipocytes.Int J Mol Sci. 2024 Jul 28;25(15):8242. doi: 10.3390/ijms25158242. Int J Mol Sci. 2024. PMID: 39125811 Free PMC article.
-
Inactivation of Myostatin Delays Senescence via TREX1-SASP in Bovine Skeletal Muscle Cells.Int J Mol Sci. 2024 May 12;25(10):5277. doi: 10.3390/ijms25105277. Int J Mol Sci. 2024. PMID: 38791317 Free PMC article.
-
Diabetic Glycation of Human Serum Albumin Affects Its Immunogenicity.Biomolecules. 2024 Nov 23;14(12):1492. doi: 10.3390/biom14121492. Biomolecules. 2024. PMID: 39766199 Free PMC article.
References
MeSH terms
Substances
Grants and funding
- 2016/15603-0/Fundação de Amparo à Pesquisa do Estado de São Paulo
- 2021/04989-3/Fundação de Amparo à Pesquisa do Estado de São Paulo
- 2022/11186-7/Fundação de Amparo à Pesquisa do Estado de São Paulo
- 2021/02401-9/Fundação de Amparo à Pesquisa do Estado de São Paulo
- 33002010062P5/Coordenação de Aperfeicoamento de Pessoal de Nível Superior
LinkOut - more resources
Full Text Sources
Research Materials

