. 2024 Feb 27;25(5):2744.
doi: 10.3390/ijms25052744.

Embryonic Amoxicillin Exposure Has Limited Impact on Liver Development but Increases Susceptibility to NAFLD in Zebrafish Larvae

Affiliations

Embryonic Amoxicillin Exposure Has Limited Impact on Liver Development but Increases Susceptibility to NAFLD in Zebrafish Larvae

Peng Gao et al. Int J Mol Sci. .

Abstract

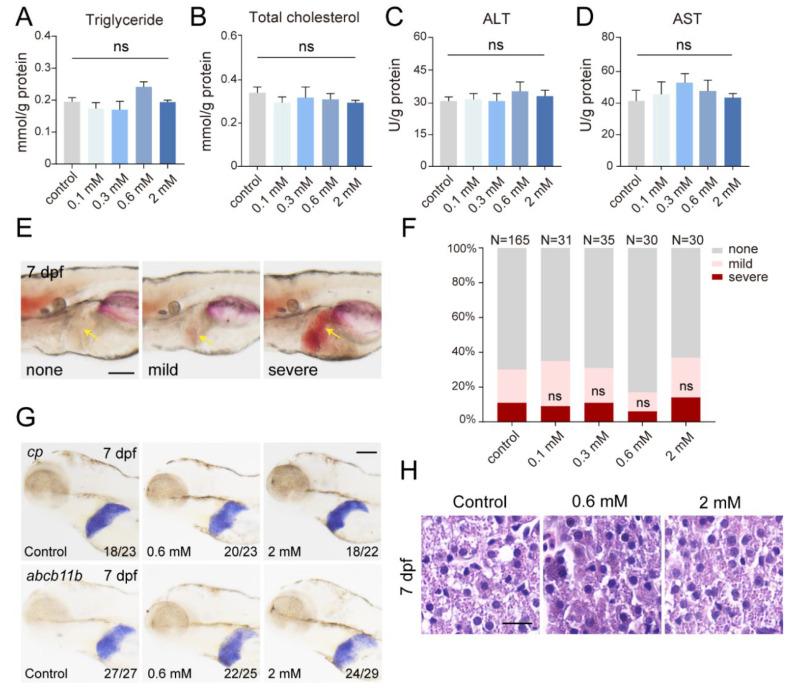
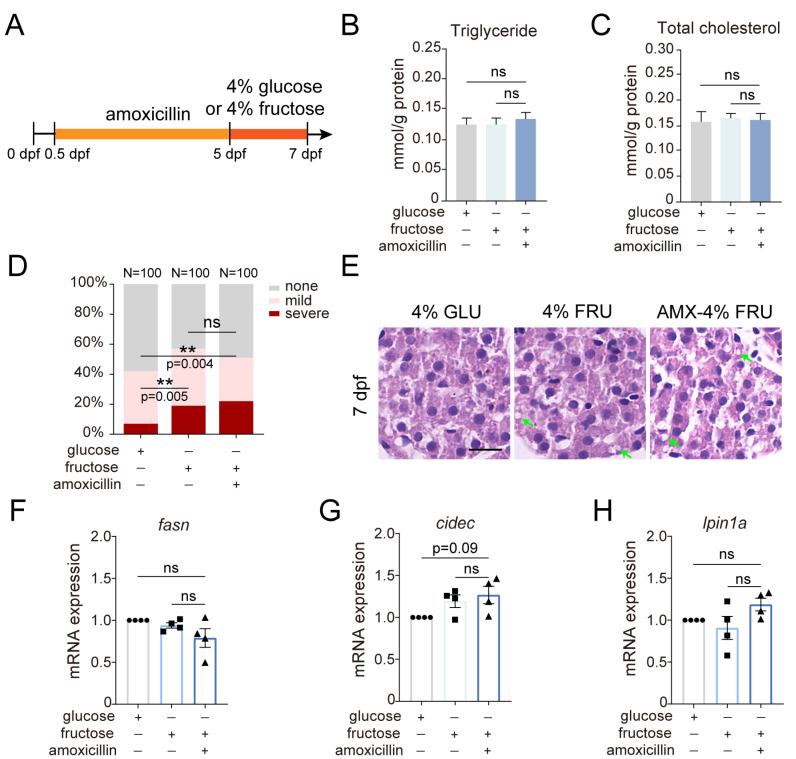
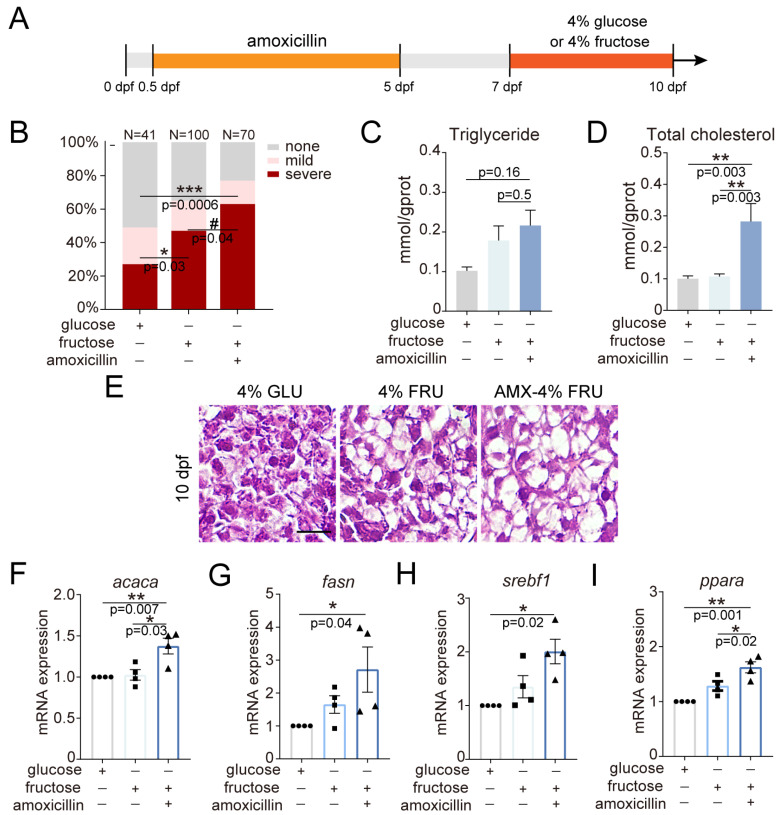
Amoxicillin is commonly used in clinical settings to target bacterial infection and is frequently prescribed during pregnancy. Investigations into its developmental toxicity and effects on disease susceptibility are not comprehensive. Our present study examined the effects of embryonic amoxicillin exposure on liver development and function, especially the effects on susceptibility to non-alcoholic fatty liver disease (NAFLD) using zebrafish as an animal model. We discovered that embryonic amoxicillin exposure did not compromise liver development, nor did it induce liver toxicity. However, co-treatment of amoxicillin and clavulanic acid diminished BESP expression, caused bile stasis and induced liver toxicity. Embryonic amoxicillin exposure resulted in elevated expression of lipid synthesis genes and exacerbated hepatic steatosis in a fructose-induced NAFLD model, indicating embryonic amoxicillin exposure increased susceptibility to NAFLD in zebrafish larvae. In summary, this research broadens our understanding of the risks of amoxicillin usage during pregnancy and provides evidence for the impact of embryonic amoxicillin exposure on disease susceptibility in offspring.

Keywords: NAFLD; amoxicillin: clavulanic acid; developmental toxicity; disease susceptibility.


Conflict of interest statement

The authors declare no conflicts of interest.

Figures

Figure 1
Figure 1
Amoxicillin treatment does not affect zebrafish liver development. (A) Schematic diagram of amoxicillin treatment. (B) Whole-mount in situ hybridization (WISH) revealed the expression of foxa3, gata6 and hhex at 2 dpf after amoxicillin treatment. Ventral view, anterior to the top. L—liver (red dashed lines); P—pancreas (green dashed lines). Numbers indicate the ratio of representative staining observed. (C) Liver (red) size at 5 dpf after amoxicillin treatment as shown in the transgenic reporter line Tg(fabp10a:mCherry; ela:eGFP). Lateral view, anterior to the left. (D) Quantification of relative liver size at 5 dpf. The numbers of larvae used for each condition are indicated. In the ANOVA analysis, ns—not significant. Scale bars, 100 µm. AMX—amoxicillin; dpf—days post-fertilization.
Figure 2
Figure 2
Amoxicillin treatment has limited impact on zebrafish liver function. (AD) Quantification of triglyceride, total cholesterol, ALT activity, and AST activity in 5 dpf larvae after amoxicillin treatment from 0.5 to 5 dpf. Three independent experiments. Mean + s.e.m. In ANOVA analysis, ns—not significant. (E) Representative Oil red O [3] staining of larvae at 7 dpf. Larvae were categorized as having none, mild, or severe hepatic steatosis. Arrows point to the liver area. (F) Quantification of hepatic steatosis by ORO staining in 7 dpf larvae after amoxicillin treatment. The numbers of larvae analyzed in each group are indicated. In Chi-square tests, ns—not significant. (G) WISH revealed the expression of cp and abcb11b at 7 dpf after amoxicillin treatment. Numbers indicate the ratio of representative staining observed. (H) H&E staining of liver tissues at 7 dpf after amoxicillin treatment from 0.5 to 5 dpf. Scale bars, (E) 50 µm, (G) 100 µm, (H) 5 µm. dpf, days post-fertilization; ALT, alanine aminotransferase; AST, aspartate aminotransferase.
Figure 3
Figure 3
Co-treatment of amoxicillin and clavulanic acid affects zebrafish liver development and function. (A) Schematic diagram of early amoxicillin and clavulanic acid co-treatment from 0.5 to 3 dpf. (B) The liver and yolk morphology of Tg(fabp10a:mCherry; ela:eGFP) larvae at 5 dpf after early amoxicillin and clavulanic acid co-treatment. The red dashed lines and arrows indicate liver area; the green dashed lines and arrows indicate yolk area. (C,D) Quantification of relative sizes of liver and yolk in 5 dpf larvae after early amoxicillin and clavulanic acid co-treatment. The numbers of larvae analyzed in each group are indicated. Mean + s.e.m. In the ANOVA analysis, * indicates p < 0.05, ns—not significant. (EH) Quantification of triglyceride, total cholesterol, ALT activity, and AST activity in 5 dpf larvae after early amoxicillin and clavulanic acid co-treatment. 3 independent experiments. Mean + s.e.m. In the ANOVA analysis, ns—not significant. (I) Schematic diagram of late amoxicillin and clavulanic acid co-treatment from 3 to 7 dpf. (J) Quantification of relative liver size in 7 dpf larvae after late amoxicillin and clavulanic acid co-treatment. The numbers of larvae analyzed in each group are indicated. Mean + s.e.m. In Student’s t-test, * indicates p < 0.05. (K) Quantification of hepatic steatosis by ORO staining in 7 dpf larvae after late amoxicillin and clavulanic acid co-treatment. The numbers of larvae analyzed in each group are indicated. In Chi-square test, * indicates p < 0.05. (L) H&E staining of liver tissues at 7 dpf after late amoxicillin and clavulanic acid co-treatment. Arrows point to fat vacuole. (M) WISH revealed the expression of abcb11b at 7dpf after late amoxicillin and clavulanic acid co-treatment. Numbers indicate the ratio of representative staining observed. Scale bars: (B,L) 100 µm, (M) 5 µm. dpf—days post-fertilization; AMX—amoxicillin; CLAV—clavulanic acid; AC—amoxicillin- clavulanic acid; L—low dose AC; M—medium dose AC; H—high dose AC.
Figure 4
Figure 4
The effect of amoxicillin pretreatment on hepatic steatosis induced by short-term fructose diet. (A) Schematic diagram of pretreatment with amoxicillin alone followed by early short-term glucose or fructose diet. (B,C) Quantification of triglyceride and total cholesterol in 7 dpf larvae subject to short-term glucose or fructose diet with amoxicillin pretreatment. 3 independent experiments. Mean + s.e.m. In the ANOVA analysis, ns—not significant. (D) Quantification of hepatic steatosis by ORO staining in 7 dpf larvae. In the Chi-square test, ns—not significant, ** indicates p < 0.01. (E) H&E staining of liver tissues at 7 dpf. Arrows point to fat vacuoles. Scale bar: 5 µm. (FH) Quantification of the expression of fasn, cidec, and lpin1a at 7 dpf by real-time PCR. Four independent experiments. Mean + s.e.m. In the ANOVA analysis, ns—not significant. dpf—days post-fertilization; AMX—amoxicillin; GLU—glucose; FRU—fructose.
Figure 5
Figure 5
The effect of amoxicillin pretreatment on hepatic steatosis induced by long-term fructose diet. (A) Schematic diagram of pretreatment with amoxicillin alone followed by later long-term glucose or fructose diet. (B) Quantification of hepatic steatosis by ORO staining in 10 dpf larvae subject to long-term glucose or fructose diet with amoxicillin pretreatment. The numbers of larvae analyzed in each group are indicated. In the Chi-square test, * and *** indicate p < 0.05, p < 0.001, and # p < 0.05, respectively. (C,D) Quantification of triglyceride and total cholesterol in 10 dpf larvae. 3 independent experiments. Mean + s.e.m. In the ANOVA analysis, ** indicates p < 0.01 (E) H&E staining of liver tissues at 10 dpf. Scale bar: 5 µm. (FI) Quantification of the expression of pparα, acaca, fasn, and srebf1 at 10 dpf by real-time PCR. Four independent experiments. Mean + s.e.m. In the ANOVA analysis, * and ** indicate p < 0.05 and p < 0.01, respectively. dpf—days post-fertilization; AMX—amoxicillin; GLU—glucose; FRU—fructose.

Similar articles

References

    1. Carlos R.Q., Seidler F.J., Slotkin T.A. Fetal dexamethasone exposure alters macromolecular characteristics of rat brain development: A critical period for regionally selective alterations? Teratology. 1992;46:45–59. doi: 10.1002/tera.1420460108. - DOI - PubMed
    1. Krontira A.C., Cruceanu C., Binder E.B. Glucocorticoids as Mediators of Adverse Outcomes of Prenatal Stress. Trends Neurosci. 2020;43:394–405. doi: 10.1016/j.tins.2020.03.008. - DOI - PubMed
    1. Baldacci S., Gorini F., Santoro M., Pierini A., Minichilli F., Bianchi F. Environmental and individual exposure and the risk of congenital anomalies: A review of recent epidemiological evidence. Epidemiol. E Prev. 2018;42((Suppl. 1)):1–34. - PubMed
    1. Henderson E., Mackillop L. Prescribing in pregnancy and during breast feeding: Using principles in clinical practice. Postgrad. Med. J. 2011;87:349–354. doi: 10.1136/pgmj.2010.103606. - DOI - PubMed
    1. Bloor M., Paech M. Nonsteroidal anti-inflammatory drugs during pregnancy and the initiation of lactation. Anesth. Analg. 2013;116:1063–1075. doi: 10.1213/ANE.0b013e31828a4b54. - DOI - PubMed

LinkOut - more resources