. 2024 Feb 27;25(5):2758.
doi: 10.3390/ijms25052758.

Intrinsic Lipid Curvature and Bilayer Elasticity as Regulators of Channel Function: A Comparative Single-Molecule Study

Affiliations

Intrinsic Lipid Curvature and Bilayer Elasticity as Regulators of Channel Function: A Comparative Single-Molecule Study

Mohammad Ashrafuzzaman et al. Int J Mol Sci. .

Abstract

Perturbations in bilayer material properties (thickness, lipid intrinsic curvature and elastic moduli) modulate the free energy difference between different membrane protein conformations, thereby leading to changes in the conformational preferences of bilayer-spanning proteins. To further explore the relative importance of curvature and elasticity in determining the changes in bilayer properties that underlie the modulation of channel function, we investigated how the micelle-forming amphiphiles Triton X-100, reduced Triton X-100 and the HII lipid phase promoter capsaicin modulate the function of alamethicin and gramicidin channels. Whether the amphiphile-induced changes in intrinsic curvature were negative or positive, amphiphile addition increased gramicidin channel appearance rates and lifetimes and stabilized the higher conductance states in alamethicin channels. When the intrinsic curvature was modulated by altering phospholipid head group interactions, however, maneuvers that promote a negative-going curvature stabilized the higher conductance states in alamethicin channels but destabilized gramicidin channels. Using gramicidin channels of different lengths to probe for changes in bilayer elasticity, we found that amphiphile adsorption increases bilayer elasticity, whereas altering head group interactions does not. We draw the following conclusions: first, confirming previous studies, both alamethicin and gramicidin channels are modulated by changes in lipid bilayer material properties, the changes occurring in parallel yet differing dependent on the property that is being changed; second, isolated, negative-going changes in curvature stabilize the higher current levels in alamethicin channels and destabilize gramicidin channels; third, increases in bilayer elasticity stabilize the higher current levels in alamethicin channels and stabilize gramicidin channels; and fourth, the energetic consequences of changes in elasticity tend to dominate over changes in curvature.

Keywords: alamethicin channel; amphiphiles; bilayer-mediated regulation; elasticity; gramicidin channel; lipid intrinsic curvature.


Conflict of interest statement

The authors declare no conflicts of interest. The funders had no role in the design of the study; in the collection, analysis or interpretation of data; in the writing of the manuscript, or in the decision to publish the results.

Figures
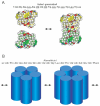
Figure 1
Figure 1
Schematic models of gramicidin and alamethicin channels. (A) Top: sequence of [Val1]gA [34], the major gramicidin species in naturally occurring mixture of peptides [35]; f is formyl, ea ethanolamine and the D-amino acids are underlined. Bottom: gramicidin channels form and disappear, as indicated by the arrows, by a transmembrane association/dissociation [36]. Left, atomic resolution structures of the β6.3-helical monomers, the two subunits are depicted some distance apart; right, atomic resolution structure of the β6.3-helical conducting dimer. The carbons in the two subunits are colored green and yellow, respectively, with the carbon atoms in the Trp side chains emphasized. Blue is nitrogen, red is oxygen and white is hydrogen. (B) Top: sequence of alamethicin I [37], the major species of alamethicin; ac is acetate, Aib α-isobutyric acid and Pheol phenylalcohol. Bottom: different interconverting oligomeric states, as indicated by the arrows, of the bilayer-spanning channel. The number of subunits may change by the association/dissociation of bilayer-spanning subunits or oligomers or by the accretion of subunits at the bilayer/solution interface that inserts into the bilayer [33,38].
Figure 2
Figure 2
Amphiphile-induced changes in alamethicin channel activity. Cpsn, TX100 and rTX100 increase Alm channel activity. Top four records: 40 s recorded before the addition of amphiphile and after the addition of the indicated amphiphile (the control traces were similar for each amphiphile trace). The calibration bars in the top trace apply to all four traces. Bottom four traces show the effect of the amphiphiles at higher resolution; calibration bars in the control trace segment apply to all the trace segments. The stippled lines denote different current levels; they do not vary with amphiphile addition (Table 1) (DOPC, 1.0 M NaCl, pH 7.0, 150 mV).
Figure 3
Figure 3
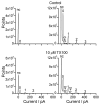
Current level (all-point) histograms showing the effects of TX100 on Alm channel function, results from one experiment. Top: results from a 40 s recording before the addition of TX100. Bottom: results from a 40 s recording in the same membrane a few min after the addition of 10 μM TX100. The right panels show the same results as the left but at an expanded scale for the ordinate. nc denotes the no-channel current level; the plots were aligned such that the nc peak is centered at 0 pA. The numbers over the peaks denote the identity of the channel state; two numbers indicate that the peak results from the superposition of two different channels (DOPC, 1.0 M NaCl, pH 7.0, 150 mV).
Figure 4
Figure 4
The variability of Alm channel activity as a function of time in the absence or presence of amphiphile. The ordinate denotes the channel activity, the time the channels reside in any conducting state relative to the no-channel state (RAlm, Equation (2)) over a 10 s time interval, normalized to the average activity over the total 80 s recording time. Mean ± S.D. based on at least three independent experiments at each condition (DOPC, 1.0 M NaCl, pH 7.0, 150 mV).
Figure 5
Figure 5
Effect of amphiphiles (TX100, rTX100 or Cpsn) on Alm channel activity. The ordinate displays the channel activity (Equation (2)) in the presence of amphiphile divided by the activity in the absence of amphiphile (RAlmAM/RAlmcntl, cf. Equation (3)). Mean ± S.D. based on at least three independent experiments, with one to three measurements, at each condition (DOPC, 1.0 M NaCl, pH 7.0, 150 mV).
Figure 6
Figure 6
Effect of TX100, rTX100 or Cpsn on the distribution of Alm channel current levels relative to the nc level. The ordinate depicts the changes in lnAkAM/AncAM/Akcntl/Anccntl, k = 0, 1, 2, 3, cf. Equation (6). Mean ± S.D. based on at least three independent experiments, each with one to three measurements, at each condition (DOPC, 1.0 M NaCl, pH 7.0, 150 mV).
Figure 7
Figure 7
Effect of TX100, rTX100 or Cpsn on the distribution of time spent in different Alm current levels relative to the time spent in level 1. The ordinate shows (ln(AkAM/A1AM/(Akcntl/A1cntl), k = 2, 3cf. Equation (7)). Left, results for TX100 and rTX100. Right, results for Cpsn. Mean ± S.D. based on at least three independent experiments, each with one to three measurements, at each condition (DOPC, 1.0 M NaCl, pH 7.0, 150 mV).
Figure 8
Figure 8
TX100 and Cpsn produce similar increases in gA channel activity. The three traces denote 60 s current traces recorded in the absence or presence of either 10 µM TX100 or 30 μM Cpsn (the control trace is from the TX100 experiment; similar single-channel activity was observed in the control trace for Cpsn). The experiments were performed using two different gA analogs, AgA(15) and gA(13), which were added together to both sides of the bilayer. AgA(15) and gA(13) channels can be distinguished by their current transition amplitudes (indicated by the horizontal dashed lines in the control current trace: blue for AgA(15) channels; red for gA(13) channels). The calibration bars in the bottom trace apply to all traces (DOPC, 1.0 M NaCl, pH 7.0, 200 mV).
Figure 9
Figure 9
Effect of TX100, rTX100 and Cpsn on the lifetimes, appearance rates, channel activities and the change in the free energies of formation (Equation (9)) of AgA(15) and gA(13) channels. (Panel (A)) shows results for τAMcntl; (panel (B)) shows results for fAM/fcntl; (panel (C)) shows results for τAM·fAMcntl·fcntl. To facilitate comparison of the results for the 13-residue and 15-residue channels, the results are displayed using logarithmic y axes. In the control experiments for TX100, τ15 and τ13 were 160 ± 13 ms and 11.6 ± 1.4 ms, respectively; in the rTX100 experiments, τ15 and τ13 were 131 ± 7 ms and 11.0 ± 0.4 ms, respectively; in the Cpsn experiments, τ15 and τ13 were 206 ± 14 ms and 15.5 ± 0.2 ms, respectively. Filled symbols—results for AgA(15) channels; open symbols—results for gA(13) channels. Mean ± S.D. based on at least three independent experiments, each with three or more measurements, at each condition (DOPC, 1.0 M NaCl, pH 7.0, 200 mV).
Figure 10
Figure 10
Amphiphiles produce larger relative changes in the lifetimes of gA(13) channels, ln{τ13AM/ τ13cntl}, as compared to AgA(15) channels, ln{τ15AM/ τ15cntl}, based on results in Figure 9. The red, blue and green dashed lines denote linear fits to the result for TX100, rTX100 and Cpsn, respectively. For TX100, the slope was 1.64 ± 0.11, r2 = 0.986 (90% confidence interval for the slope, 1.29–1.99); for rTX100, the slope was 1.21 ± 0.04, r2 = 0.997 (90% confidence interval for the slope, 1.09–1.33); for Cpsn, the slope was 1.26 ± 0.05, r2 = 0.995 (90% confidence interval for the slope, 1.10–1.42). The black interrupted line has a slope of 1. (DOPC, 1.0 M NaCl, pH 7.0, 200 mV).
Figure 11
Figure 11
Amphiphile-induced changes in Alm function as functions of the changes in AgA(15) channel lifetimes. (A): Effect of TX100 (4, 10, 30 µM), rTX100 (4, 10, 30 µM) or Cpsn (10, 30, 100 µM) on Alm channel activity, expressed as lnRAlmAM/RAlmcntl, cf. Equation (3), as functions of the corresponding changes in lnτ15AM/τ15cntl. Based on results in Figure 5, Figure 7 and Figure 9. The red, blue and green dashed lines denote linear fits to the results, including 0 µM, for TX100, rTX100 and Cpsn, respectively. For TX100, the slope was 1.74, ± 0.08; r2 = 0.994 (90% confidence interval for the slope, 1.15–3.60); for rTX100, the slope was 1.61 ± 0.22, r2 = 0.940 (90% confidence interval for the slope, 0.89–2.33); for Cpsn, the slope was 2.37 ± 0.40, r2 = 0.920 (90% confidence interval for the slope, 1.15–3.60) (DOPC, 1.0 M NaCl, pH 7.0). (B): Effect of TX100, rTX100 or Cpsn on the distribution between Alm current level 1 and 2, expressed as ln(A 2AM/A 1AM)/(A 2cntl/A 1cntl), cf. Equation (7), as functions of the corresponding changes in lnτ15AM/τ15cntl. The dashed lines denote linear fits to the results, including 0 µM. For TX100, the slope was 0.51 ± 0.06, r2 = 0.959 (90% confidence interval for the slope, 0.33–0.70); for rTX100, the slope was 0.37 ± 0.08, r2 = 0872 (90% confidence interval for the slope, 0.13–0.61); for Cpsn, the slope was 0.59 ± 0.12, r2 = 0.920 (90% confidence interval for the slope, 0.24–0.95) (DOPC, 1.0 M NaCl, pH 7.0).

Similar articles

Cited by

References

    1. Sandermann H.J. Regulation of membrane enzymes by lipids. Biochim. Biophys. Acta. 1978;515:209–237. doi: 10.1016/0304-4157(78)90015-1. - DOI - PubMed
    1. Spector A.A., Yorek M.A. Membrane lipid composition and cellular function. J. Lipid Res. 1985;26:1015–1035. doi: 10.1016/S0022-2275(20)34276-0. - DOI - PubMed
    1. Bienvenüe A., Marie J.S. Modulation of protein function by lipids. Curr. Top. Membr. 1994;40:319–354.
    1. Brown M.F. Modulation of rhodopsin function by properties of the membrane bilayer. Chem. Phys. Lipids. 1994;73:159–180. doi: 10.1016/0009-3084(94)90180-5. - DOI - PubMed
    1. Lee A.G. How lipids and proteins interact in a membrane: A molecular approach. Mol. Biosyst. 2005;1:203–212. doi: 10.1039/b504527d. - DOI - PubMed

LinkOut - more resources