. 2024 Feb 28;25(5):2773.
doi: 10.3390/ijms25052773.

FlashPCR: Revolutionising qPCR by Accelerating Amplification through Low ∆T Protocols

Affiliations

FlashPCR: Revolutionising qPCR by Accelerating Amplification through Low ∆T Protocols

Stephen A Bustin et al. Int J Mol Sci. .

Abstract

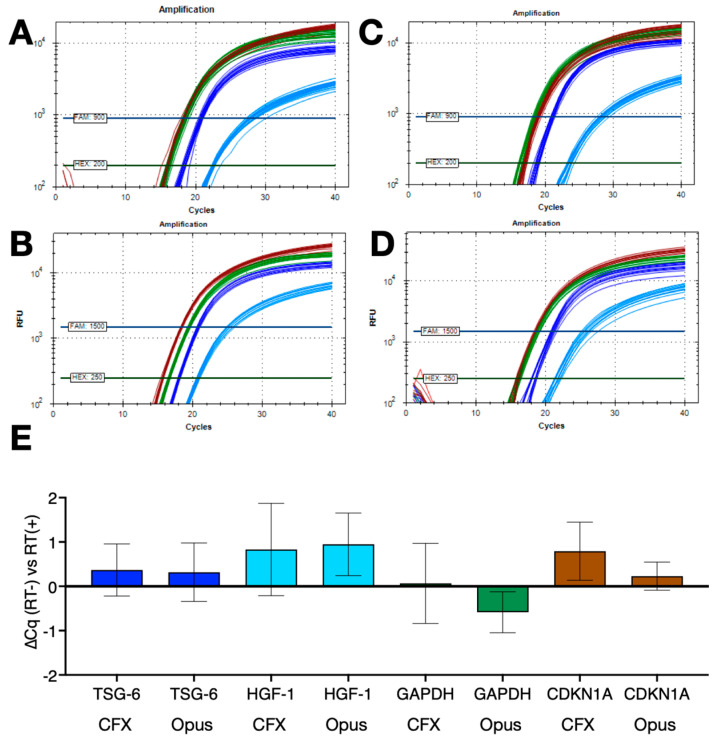
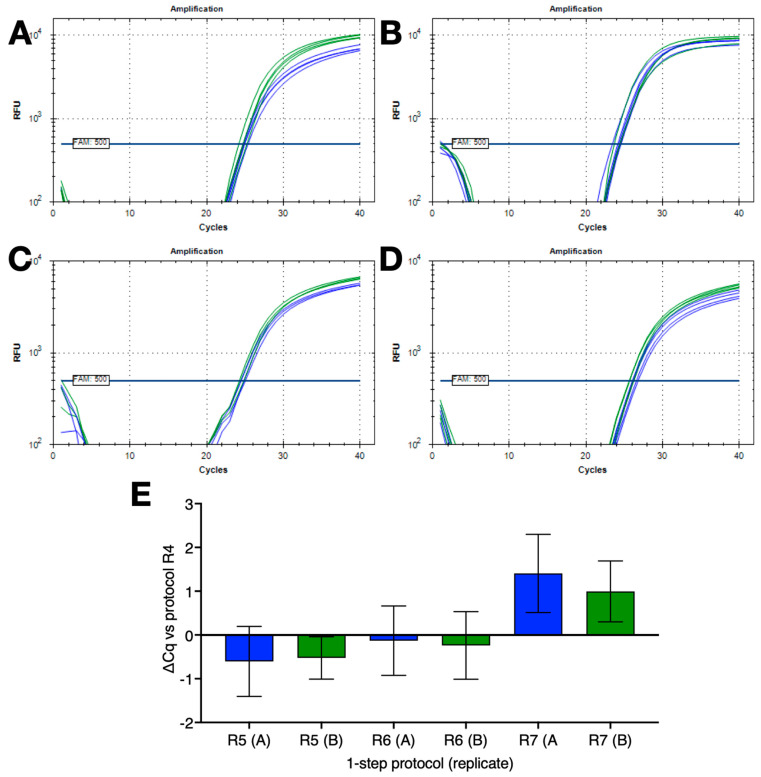
Versatility, sensitivity, and accuracy have made the real-time polymerase chain reaction (qPCR) a crucial tool for research, as well as diagnostic applications. However, for point-of-care (PoC) use, traditional qPCR faces two main challenges: long run times mean results are not available for half an hour or more, and the requisite high-temperature denaturation requires more robust and power-demanding instrumentation. This study addresses both issues and revises primer and probe designs, modified buffers, and low ∆T protocols which, together, speed up qPCR on conventional qPCR instruments and will allow for the development of robust, point-of-care devices. Our approach, called "FlashPCR", uses a protocol involving a 15-second denaturation at 79 °C, followed by repeated cycling for 1 s at 79 °C and 71 °C, together with high Tm primers and specific but simple buffers. It also allows for efficient reverse transcription as part of a one-step RT-qPCR protocol, making it universally applicable for both rapid research and diagnostic applications.

Keywords: COVID-19; molecular diagnostics; point of care; qPCR; reverse transcription.


Conflict of interest statement

Author G.L.S. owns his consulting business Shipley Consulting. G.L.S. and the remaining authors declare that the research was conducted in the absence of any commercial or financial relationships that could be construed as potential conflicts of interest. The funders had no role in the design of the study; in the collection, analyses, or interpretation of data; in the writing of the manuscript; or in the decision to publish the results.

Figures

Figure 1
Figure 1
Amplification of SARS-CoV-2 cDNA with assay CoV-E. Horizontal lines show the position of the threshold used to calculate Cq values. (A) Amplification plots for B47 (blue), commercial master mixes 1 (brown) and 2 (green) targeting SARS-CoV-2 cDNA using denaturation protocol P2 on a BioRad CFX Connect. (B) Amplification plots recorded for B47 (blue), commercial master mixes 1 (brown) and 2 (green) targeting SARS-CoV-2 cDNA using polymerisation protocol P3 on a BioRad CFX Connect. (C) ∆Cq values (±95% CI) against 85 °C recorded at each denaturation temperature with B47 and B50 and cDNA (green, n = 36) or PCR amplicons (brown, n = 29) calculated from combining the data acquired on BioRad CFX Connect and Opus instruments. (D) ∆Cq values (±95% CI) against 67 °C at each polymerisation temperature with B47 or B50 and cDNA (green, n = 36) or PCR amplicons (brown, n = 26) calculated from combining the data acquired on BioRad CFX Connect and Opus instruments. All Cq values are listed in the Supplementary Data file.
Figure 2
Figure 2
Limit of detection. (A) 1-D amplitude plot of 8 replicates of the highest dilution of the SARS-CoV-2 cDNA sample, with the positives (blue) clearly distinguished from the negatives (grey). The copy numbers/reaction were determined by the BioRad QX200 instrument software. (Version 2.1, BioRad, Watford, UK). (B) Amplification plots recorded for each of the replicate reactions (58 copies blue, 29 copies green, 15 copies orange, 8 copies red). Horizontal lines show the position of the threshold used to calculate Cq values. (C.) Cq values (green) recorded for each of the replicate reactions, with absence of amplification shaded red. (D) 1-D amplitude plot of duplicate dilutions of SARS-CoV-2 cDNA sample, including two NTCs, with the positives (blue) clearly distinguished from the negatives (grey). The copy numbers/reaction were determined by the BioRad QX200 instrument software (Version 2.1, BioRad, Watford, UK). (E) Amplification plots recorded for each of the replicate reactions (198 copies blue, 29 copies green, 10 copies orange). Horizontal lines show the position of the threshold used to calculate Cq values. (F) Cq values recorded for each of the replicate reactions. NTCs did not record Cq values.
Figure 3
Figure 3
Amplification of S. aureus gDNA with B25 on denaturation or polymerisation gradients on a BioRad CFX Connect. (A) Amplification plots recorded on the denaturation gradient using protocol P12. Horizontal lines show the position of the threshold used to calculate Cq values. (B) Amplification plots on the polymerisation gradient using protocol P13. Horizontal lines show the position of the threshold used to calculate Cq values. (C) ∆Cq values (±95% CI) recorded with P5 (∆T = 9 °C) and P14 (∆T = 11 °C) versus protocol P1. All Cq values are listed in the Supplementary Data file.
Figure 4
Figure 4
One-step RT-qPCR assays with SARS-CoV-2 genomic RNA or breast cancer mRNA. (A) Amplification plots recorded with CoV-E and Nsp10 assays and PCRBio Clara (dark blue/light blue), NEB Luna (brown/orange) 1-step RT-qPCR mastermixes, as well as the B47-based 1-step master mix with UltraScript RT and MyTaq polymerase (dark green/light green) run on a Hybaid PrimePro 48 qPCR instrument. Horizontal lines show the position of the threshold used to calculate Cq values. (B) Cq values ± SD. (C) Amplification plots recorded with dual-plex TSG-6 and HGF-1 assays and B25 (dark blue/light blue), B27 (dark green/light green), B47 (brown/orange) or B50 (dark pink/light pink)-based 1-step master mix with UltraScript RT and MyTaq polymerase BioRad CFX Opus qPCR instrument. Horizontal lines show the positions of the FAM and HEX thresholds used to calculate Cq values. (D) Plot of Cq values ± SD. All Cq values are listed in the Supplementary Data file.
Figure 5
Figure 5
Repeatability of 1-step RT-qPCR protocols with and without dedicated RT steps and assays TSG-6 (blue), HGF-1 (light blue), GAPDH (green) or CDKN1 (brown). (A) Amplification plots recorded for 16 replicate reactions using RT+ protocol R2 on the BioRad CFX Connect. Horizontal lines show the positions of the FAM and HEX thresholds used to calculate Cq values. (B) Amplification plots recorded for 9 replicate reactions using RT+ protocol R2 on the BioRad Opus. Horizontal lines show the positions of the FAM and HEX thresholds used to calculate Cq values. (C) Amplification plots recorded for 16 replicate reactions using the no RT protocol R3 on the BioRad CFX Connect. Horizontal lines show the positions of the FAM and HEX thresholds used to calculate Cq values. (D) Amplification plots recorded for 9 replicate reactions using the no RT protocol R3 on the BioRad Opus. Horizontal lines show the positions of the FAM and HEX thresholds used to calculate Cq values. (E) ∆Cq values (±95% CI) of the reactions carried out with protocol R3 versus those carried out with protocol R2 (TSG-6 dark blue, HGF-1 light blue, GAPDH green, CDKN1A brown). All Cq values are listed in the Supplementary Data file.
Figure 6
Figure 6
Comparison of 1-step RT-qPCR protocols with no dedicated RT steps coupled with FlashPCR protocol targeting SARS-CoV-2 gRNA. (A) Amplification plots recorded for replicate set-ups and reactions using protocol R4 (∆T = 30 °C) on a BioRad CFX instrument. Horizontal lines show the positions of the FAM and HEX thresholds used to calculate Cq values. (B) Amplification plots recorded for replicate set-ups and reactions using protocol R5 (∆T = 9 °C) on a BioRad CFX instrument. Horizontal lines show the positions of the FAM and HEX thresholds used to calculate Cq values. (C) Amplification plots recorded for replicate set-ups and reactions using protocol R6 (∆T = 10 °C) on a BioRad CFX instrument. Horizontal lines show the positions of the FAM and HEX thresholds used to calculate Cq values. (D) Amplification plots recorded for replicate set-ups and reactions using protocol R7 (∆T = 9 °C) on a BioRad CFX instrument. Horizontal lines show the positions of the FAM and HEX thresholds used to calculate Cq values. (E) ∆Cq values (±95% CI) of the various reactions versus those carried out with protocol R4 (∆T = 30 °C). All Cq values are listed in the Supplementary Data file.

Similar articles

Cited by

References

    1. Higuchi R., Dollinger G., Walsh P.S., Griffith R. Simultaneous amplification and detection of specific DNA sequences. Bio/Technology. 1992;10:413–417. doi: 10.1038/nbt0492-413. - DOI - PubMed
    1. Higuchi R., Fockler C., Dollinger G., Watson R. Kinetic PCR analysis: Real-time monitoring of DNA amplification reactions. Bio/Technology. 1993;11:1026–1030. - PubMed
    1. Bustin S.A., Mueller R. Real-time reverse transcription PCR (qRT-PCR) and its potential use in clinical diagnosis. Clin. Sci. 2005;109:365–379. doi: 10.1042/CS20050086. - DOI - PubMed
    1. Bustin S., Penning L.C. Improving the analysis of quantitative PCR data in veterinary research. Vet. J. 2012;191:279–281. doi: 10.1016/j.tvjl.2011.06.044. - DOI - PubMed
    1. Lopez M.M., Llop P., Olmos A., Marco-Noales E., Cambra M., Bertolini E. Are molecular tools solving the challenges posed by detection of plant pathogenic bacteria and viruses? Curr. Issues Mol. Biol. 2009;11:13–46. - PubMed

MeSH terms

LinkOut - more resources