. 2024 Feb 28;25(5):2790.
doi: 10.3390/ijms25052790.

Protein Kinase D Plays a Crucial Role in Maintaining Cardiac Homeostasis by Regulating Post-Translational Modifications of Myofilament Proteins

Affiliations

Protein Kinase D Plays a Crucial Role in Maintaining Cardiac Homeostasis by Regulating Post-Translational Modifications of Myofilament Proteins

Melissa Herwig et al. Int J Mol Sci. .

Abstract

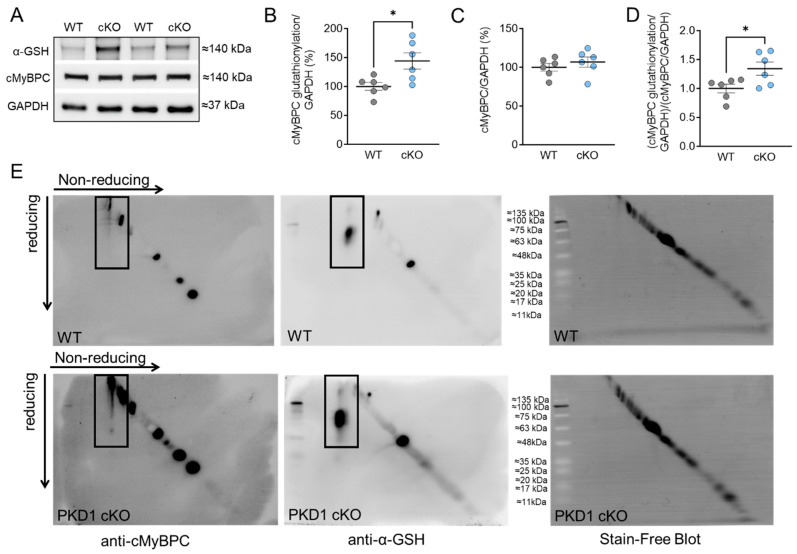
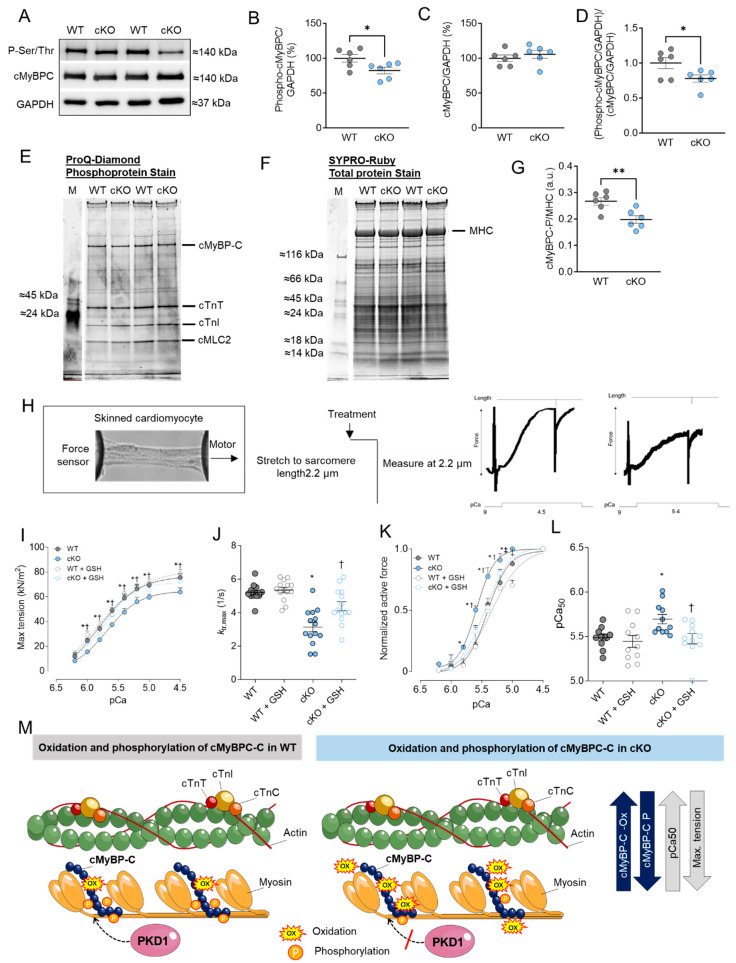
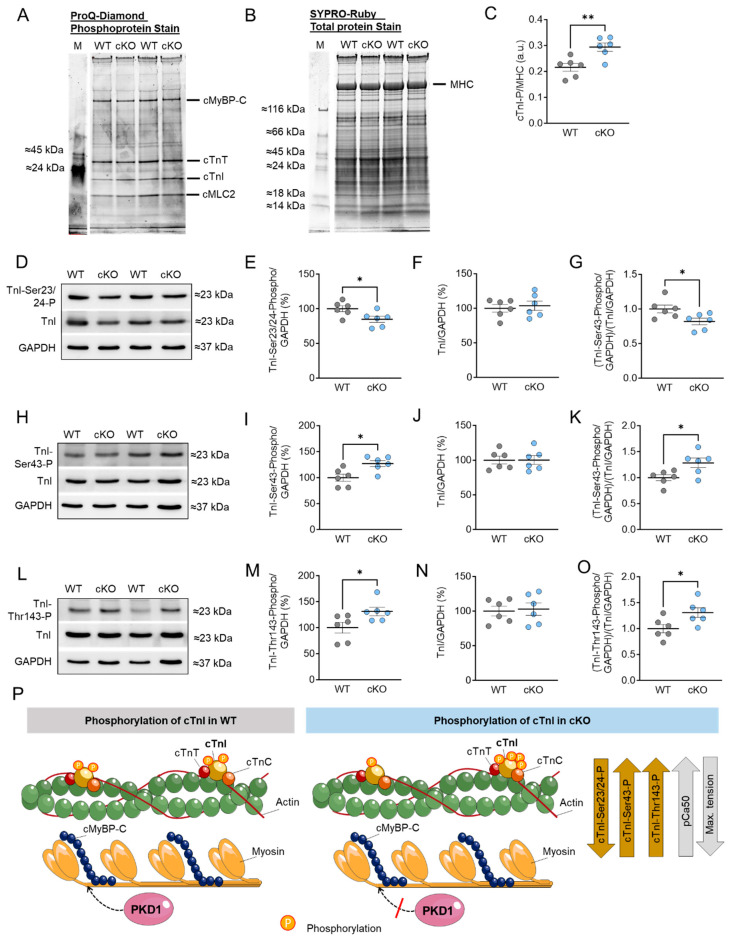
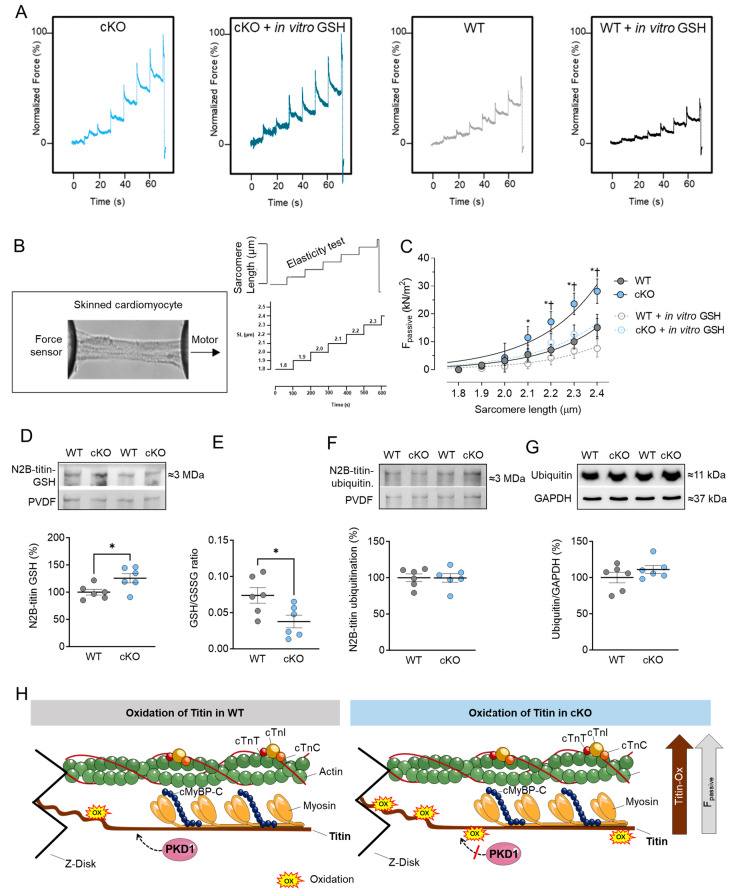
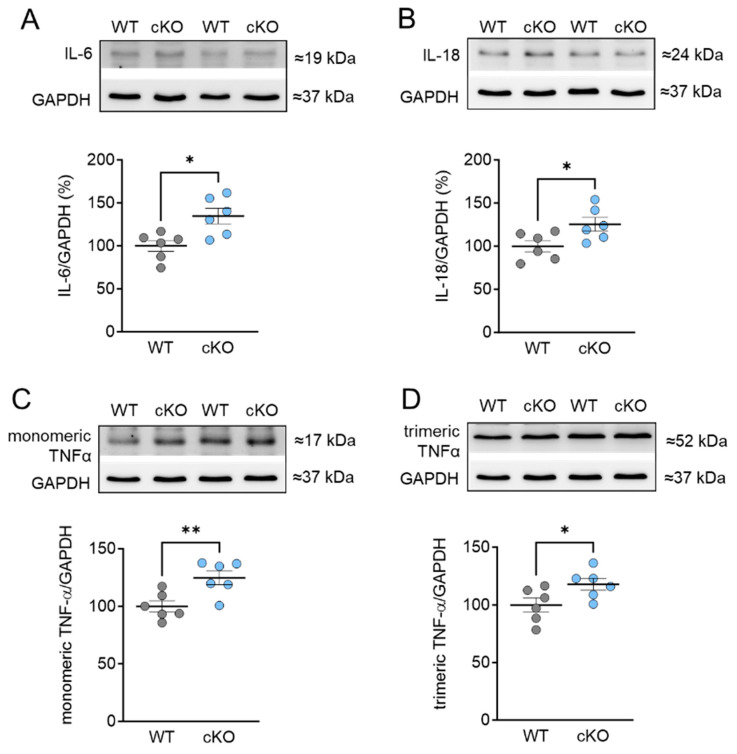
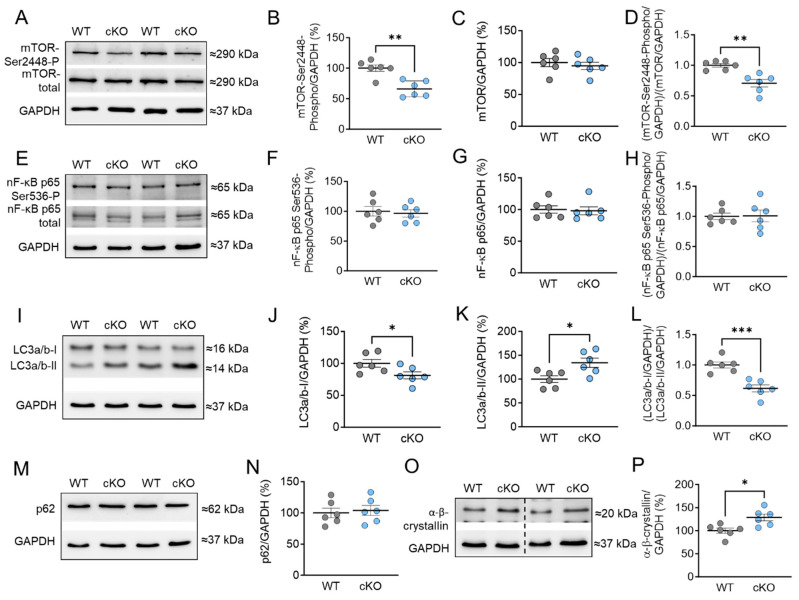
Protein kinase D (PKD) enzymes play important roles in regulating myocardial contraction, hypertrophy, and remodeling. One of the proteins phosphorylated by PKD is titin, which is involved in myofilament function. In this study, we aimed to investigate the role of PKD in cardiomyocyte function under conditions of oxidative stress. To do this, we used mice with a cardiomyocyte-specific knock-out of Prkd1, which encodes PKD1 (Prkd1loxP/loxP; αMHC-Cre; PKD1 cKO), as well as wild type littermate controls (Prkd1loxP/loxP; WT). We isolated permeabilized cardiomyocytes from PKD1 cKO mice and found that they exhibited increased passive stiffness (Fpassive), which was associated with increased oxidation of titin, but showed no change in titin ubiquitination. Additionally, the PKD1 cKO mice showed increased myofilament calcium (Ca2+) sensitivity (pCa50) and reduced maximum Ca2+-activated tension. These changes were accompanied by increased oxidation and reduced phosphorylation of the small myofilament protein cardiac myosin binding protein C (cMyBPC), as well as altered phosphorylation levels at different phosphosites in troponin I (TnI). The increased Fpassive and pCa50, and the reduced maximum Ca2+-activated tension were reversed when we treated the isolated permeabilized cardiomyocytes with reduced glutathione (GSH). This indicated that myofilament protein oxidation contributes to cardiomyocyte dysfunction. Furthermore, the PKD1 cKO mice exhibited increased oxidative stress and increased expression of pro-inflammatory markers interleukin (IL)-6, IL-18, and tumor necrosis factor alpha (TNF-α). Both oxidative stress and inflammation contributed to an increase in microtubule-associated protein 1 light chain 3 (LC3)-II levels and heat shock response by inhibiting the mammalian target of rapamycin (mTOR) in the PKD1 cKO mouse myocytes. These findings revealed a previously unknown role for PKD1 in regulating diastolic passive properties, myofilament Ca2+ sensitivity, and maximum Ca2+-activated tension under conditions of oxidative stress. Finally, we emphasized the importance of PKD1 in maintaining the balance of oxidative stress and inflammation in the context of autophagy, as well as cardiomyocyte function.

Keywords: autophagy; inflammation; myofilament proteins; protein kinase D; protein oxidation.


Conflict of interest statement

The authors declare no conflict of interest.

Figures

Figure 1
Figure 1
Cardiac myosin binding protein C (cMyBPC) oxidation in PKD1 cKO and WT cardiomyocytes. (A) Representative Western blots of cMyBPC-oxidation, cMyBPC-protein content and loading control GAPDH. Ratios of (B) glutathionylated cMyBPC over GAPDH, (C) cMyBPC-protein content over GAPDH and (D) glutathionylated over total cMYBPC (both normalized to GAPDH). Data are shown as mean ± SEM; n = 6 samples/group. * p < 0.05 PKD1 cKO vs. WT via unpaired Student’s t-test. (E) Representative diagonal gel electrophoresis of the WT (top panel) and PKD1 cKO (bottom panel). The non-reduced and reduced dimensions are shown in the image, with the molecular weight of the protein size standard in the center. Samples were initially run under non-reducing conditions in the first dimension and under reducing conditions in the second dimension. Blots were incubated with anti-cMyBPC antibody (left panel) and anti-glutathione (α-GSH; center panel). The stain-free blots are shown in the right panel. The black boxes indicate the oxidation of cMyBPC (left panel) and the glutathionylation (center panel), respectively.
Figure 2
Figure 2
cMyBPC phosphorylation, cardiomyocyte max tension and calcium (Ca2+) sensitivity in PKD1 cKO and WT cardiomyocytes. (A) Representative Western blots of cMyBPC-phosphorylation, cMyBPC-protein content and loading control GAPDH. Ratios of (B) phosphorylated cMyBPC over GAPDH, (C) cMyBPC-protein content over GAPDH and (D) phosphorylated over total cMyBPC (both normalized to GAPDH). (E) ProQ-Diamond phosphoprotein stain, (F) SYPRO Ruby total protein stain and (G) ratio of phosphorylated cMyBPC over myosin heavy chain (MHC). (H) Representative image of skinned cardiomyocytes and stretch protocol. (I) Maximum tension of PKD1 cKO and WT cardiomyocytes before and after in vitro treatment with reduced glutathione (GSH) at different Ca2+ concentrations. (J) Cross-bridge cycling kinetics (ktr) at saturating [Ca2+] (at pCa 4.5; ktr, max) before and after in vitro GSH treatment. (K) Ca2+ sensitivity of PKD1 cKO and WT cardiomyocytes before and after in vitro GSH treatment different [Ca2+]. (L) pCa value for the half-maximal Ca2+-induced contraction before and after in vitro GSH. Data are shown as mean ± SEM; n = 6 samples/group. * p < 0.05 and ** p < 0.01 PKD1 cKO vs. WT via unpaired Student’s t-test. Panels (IL): data are shown as mean ± SEM, (n = 16–20/4 cardiomyocytes/heart). * p < 0.05 PKD1cKO vs. WT, † p < 0.05 PKD1 cKO before vs. after GSH and ‡ p < 0.05 WT before vs. after GSH via one-way ANOVA. p-values were corrected for multiple comparisons via the Tukey method. (M) Scheme summarising the observed results in relation to the oxidation and phosphorylation of cMyBPC in WT and PKD1 cKO.
Figure 3
Figure 3
Cardiac troponin I (cTnI) phosphorylation in PKD1 cKO and WT hearts. (A) ProQ-Diamond phosphoprotein stain, (B) SYPRO Ruby total protein stain and (C) ratio of phosphorylated cTnI over myosin heavy chain (MHC). (D) Representative Western blots of TnI phosphorylation at Ser23/24, TnI-protein content and loading control GAPDH. Ratios of (E) TnI phosphorylation at Ser23/24 over GAPDH, (F) TnI-protein content over GAPDH and (G) TnI phosphorylation at Ser23/24 over TnI-protein content (both normalized to GAPDH). (H) Representative Western blots of TnI phosphorylation at Ser43, TnI-protein content and loading control GAPDH. Ratios of (I) TnI phosphorylation at Ser43 over GAPDH, (J) TnI-protein content over GAPDH and (K) TnI phosphorylation at Ser43 over TnI-protein content (both normalized to GAPDH). (L) Representative Western blots of TnI phosphorylation at Thr143, TnI-protein content and loading control GAPDH. Ratios of (M) TnI phosphorylation at Thr143 over GAPDH, (N) TnI-protein content over GAPDH and (O) TnI phosphorylation at Thr143 over TnI-protein content (both normalized to GAPDH). Data are shown as mean ± SEM; n = 6 samples/group. * p < 0.05 and ** p < 0.01 PKD1 cKO vs. WT via unpaired Student’s t-test. (P) Scheme summarising the observed results in relation to the phosphorylation of cTnI in WT and PKD1 cKO.
Figure 4
Figure 4
Cardiomyocyte passive stiffness (Fpassive) and titin glutathionylation and ubiquitination in PKD1 cKO and WT hearts. (A) Original recordings. (B) Stretch protocol of the force response to stepwise cell stretching of isolated skinned cardiomyocytes. (C) Fpassive at sarcomere length 1.8–2.4 µm in the presence or absence of reduced glutathione (GSH). Curves are second-order polynomial fits to the means (±SEM; n = 16–20/4 cardiomyocytes/heart). * p < 0.05 PKD1 cKO vs. WT, † p < 0.05 PKD1 cKO before vs. after GSH via one-way ANOVA. (D) N2B-titin glutathionylation, (E) Ratio of reduced glutathione (GSH) over oxidized glutathione (GSSG), (F) N2B-titin ubiquitination and (G) ubiquitination levels in PKD1 cKO and WT hearts. Data are shown as mean ± SEM; n = 6 samples/group. * p < 0.05 PKD1 cKO vs. WT via unpaired Student’s t-test. (H) Scheme summarising the observed results in relation to the oxidation of titin in WT and PKD1 cKO.
Figure 5
Figure 5
Expression of pro-inflammatory cytokines in PKD1 cKO and WT hearts. (A) Interleukin-6 (IL-6) protein level, (B) interleukin-18 (IL-18) protein level, (C) monomeric tumor necrosis factor alpha (TNF α) protein level and (D) trimeric TNF α protein level. Data are shown as mean ± SEM; n = 6 samples/group. * p < 0.05 and ** p < 0.01 PKD1 cKO vs. WT via unpaired Student’s t-test.
Figure 6
Figure 6
Markers of autophagy and stress signaling in PKD1 cKO and WT hearts. (A) Representative Western blots of mammalian target of rapamycin (mTOR)-phosphorylation at Ser2448, mTOR protein level and loading control GAPDH. Ratios of (B) phosphorylated mTOR over GAPDH, (C) mTOR-protein level over GAPDH, and (D) phosphorylated over total mTOR (both normalized to GAPDH). (E) Representative Western blots of nuclear factor kappa-light-chain-enhancer of activated B cells (NF-κB)-phosphorylation at Ser536, protein level and loading control GAPDH. Ratios of (F) phosphorylated NF-κB over GAPDH, (G) NF-κB-protein level over GAPDH, and (H) phosphorylated over total NF-κB (both normalized to GAPDH). (I) Representative Western blots of light chain 3 protein (LC3) forms I and II and loading control GAPDH. Ratios of (J) LC3-I over GAPDH, (K) LC3-II over GAPDH, and (L) LC3-I over LC3-II (both normalized to GAPDH). (M) Western blot of Sequestosome 1 (p62) marker and (N) p62 protein level. (O) Western blot of α-β-crystallin and (P) α-β-crystallin protein level. Data are shown as mean ± SEM; n = 6 samples/group. * p < 0.05, ** p < 0.01 and *** p < 0.001 PKD1 cKO vs. WT via unpaired Student’s t-test.

Similar articles

Cited by

References

    1. Haworth R.S., Roberts N.A., Cuello F., Avkiran M. Regulation of Protein Kinase D Activity in Adult Myocardium: Novel Counter-Regulatory Roles for Protein Kinase Cepsilon and Protein Kinase A. J. Mol. Cell. Cardiol. 2007;43:686–695. doi: 10.1016/j.yjmcc.2007.09.013. - DOI - PubMed
    1. Avkiran M., Rowland A.J., Cuello F., Haworth R.S. Protein Kinase D in the Cardiovascular System: Emerging Roles in Health and Disease. Circ. Res. 2008;102:157–163. doi: 10.1161/CIRCRESAHA.107.168211. - DOI - PubMed
    1. Dirkx E., Schwenk R.W., Coumans W.A., Hoebers N., Angin Y., Viollet B., Bonen A., Van Eys G.J.J.M., Glatz J.F.C., Luiken J.J.F.P. Protein Kinase D1 Is Essential for Contraction-Induced Glucose Uptake but Is Not Involved in Fatty Acid Uptake into Cardiomyocytes. J. Biol. Chem. 2012;287:5871–5881. doi: 10.1074/jbc.M111.281881. - DOI - PMC - PubMed
    1. Wood B.M., Bossuyt J. Emergency Spatiotemporal Shift: The Response of Protein Kinase D to Stress Signals in the Cardiovascular System. Front. Pharmacol. 2017;8:9. doi: 10.3389/fphar.2017.00009. - DOI - PMC - PubMed
    1. Fielitz J., Kim M.S., Shelton J.M., Qi X., Hill J.A., Richardson J.A., Bassel-Duby R., Olson E.N. Requirement of Protein Kinase D1 for Pathological Cardiac Remodeling. Proc. Natl. Acad. Sci. USA. 2008;105:3059–3063. doi: 10.1073/pnas.0712265105. - DOI - PMC - PubMed

LinkOut - more resources