

Dynamics of Chromatin Opening across Larval Development in the Urochordate Ascidian Ciona savignyi
- PMID: 38474039
- PMCID: PMC10931586
- DOI: 10.3390/ijms25052793
Dynamics of Chromatin Opening across Larval Development in the Urochordate Ascidian Ciona savignyi
Abstract
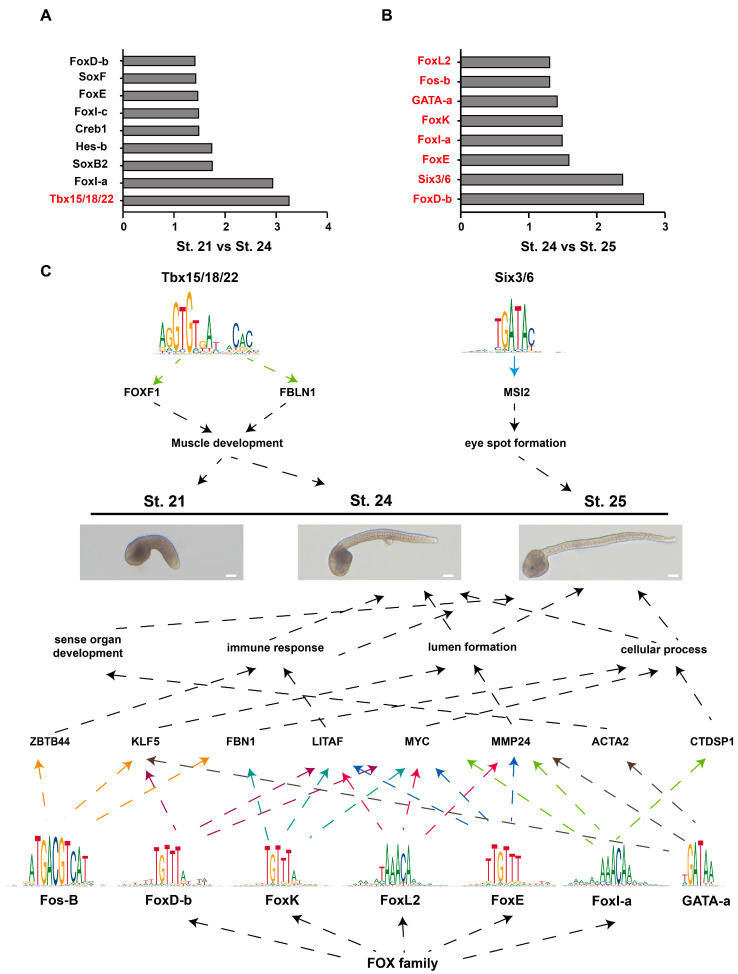
Ascidian larvae undergo tail elongation and notochord lumenogenesis, making them an ideal model for investigating tissue morphogenesis in embryogenesis. The cellular and mechanical mechanisms of these processes have been studied; however, the underlying molecular regulatory mechanism remains to be elucidated. In this study, assays for transposase-accessible chromatin using sequencing (ATAC-seq) and RNA sequencing (RNA-seq) were applied to investigate potential regulators of the development of ascidian Ciona savignyi larvae. Our results revealed 351 and 138 differentially accessible region genes through comparisons of ATAC-seq data between stages 21 and 24 and between stages 24 and 25, respectively. A joint analysis of RNA-seq and ATAC-seq data revealed a correlation between chromatin accessibility and gene transcription. We further verified the tissue expression patterns of 12 different genes. Among them, Cs-matrix metalloproteinase 24 (MMP24) and Cs-krüppel-like factor 5 (KLF5) were highly expressed in notochord cells. Functional assay results demonstrated that both genes are necessary for notochord lumen formation and expansion. Finally, we performed motif enrichment analysis of the differentially accessible regions in different tailbud stages and summarized the potential roles of these motif-bearing transcription factors in larval development. Overall, our study found a correlation between gene expression and chromatin accessibility and provided a vital resource for understanding the mechanisms of the development of ascidian embryos.
Keywords: ATAC-seq; RNA-seq; ascidian; gene expression; open chromatin; transcription factor.
Conflict of interest statement
The authors declare no conflicts of interest.
Figures


Similar articles
-
MiR-92 Family Members Form a Cluster Required for Notochord Tubulogenesis in Urochordate Ciona savignyi.Genes (Basel). 2021 Mar 12;12(3):406. doi: 10.3390/genes12030406. Genes (Basel). 2021. PMID: 33809016 Free PMC article.
-
Identification and characterization of microRNAs involved in ascidian larval metamorphosis.BMC Genomics. 2018 Mar 1;19(1):168. doi: 10.1186/s12864-018-4566-4. BMC Genomics. 2018. PMID: 29490613 Free PMC article.
-
Identification and expression analysis of long noncoding RNAs in embryogenesis and larval metamorphosis of Ciona savignyi.Mar Genomics. 2018 Jul;40:64-72. doi: 10.1016/j.margen.2018.05.001. Epub 2018 May 10. Mar Genomics. 2018. PMID: 29754835
-
[Advances in assay for transposase-accessible chromatin with high-throughput sequencing].Yi Chuan. 2020 Apr 20;42(4):333-346. doi: 10.16288/j.yczz.19-279. Yi Chuan. 2020. PMID: 32312702 Review. Chinese.
-
Interrogating the Accessible Chromatin Landscape of Eukaryote Genomes Using ATAC-seq.Methods Mol Biol. 2021;2243:183-226. doi: 10.1007/978-1-0716-1103-6_10. Methods Mol Biol. 2021. PMID: 33606259 Review.
Cited by
-
Snail Transcriptionally Represses Brachyury to Promote the Mesenchymal-Epithelial Transition in Ascidian Notochord Cells.Int J Mol Sci. 2024 Mar 18;25(6):3413. doi: 10.3390/ijms25063413. Int J Mol Sci. 2024. PMID: 38542387 Free PMC article.
References
-
- Schaeffer B. Deuterostome Monophyly and Phylogeny. Evol. Biol. 1987;21:179–235.
MeSH terms
Substances
Grants and funding
LinkOut - more resources
Full Text Sources
