. 2024 Feb 29;25(5):2817.
doi: 10.3390/ijms25052817.

Circ MTA2 Drives Gastric Cancer Progression through Suppressing MTA2 Degradation via Interacting with UCHL3

Affiliations

Circ MTA2 Drives Gastric Cancer Progression through Suppressing MTA2 Degradation via Interacting with UCHL3

Gengchen Xie et al. Int J Mol Sci. .

Abstract

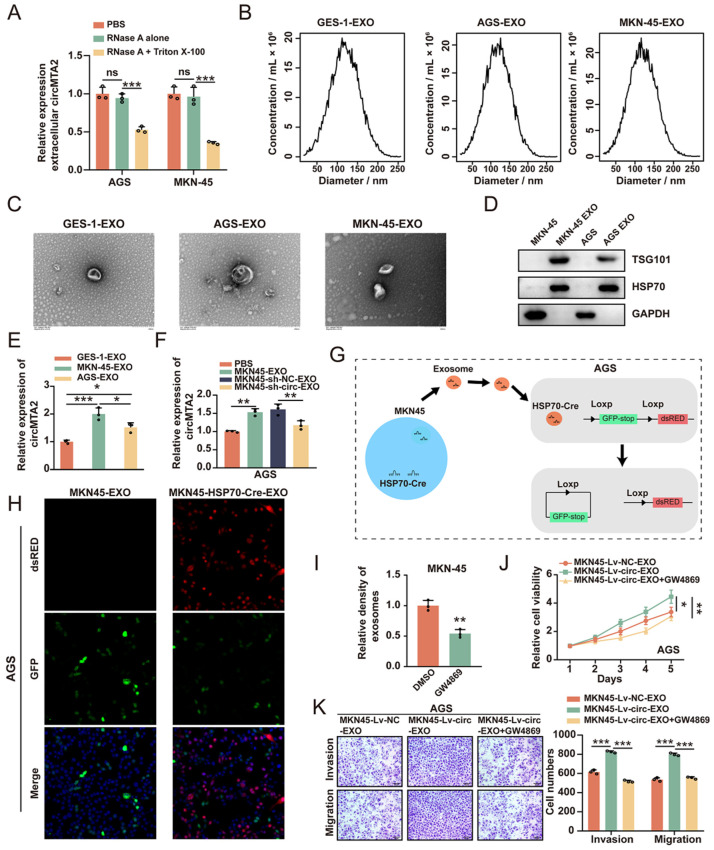
Our previous study has reported that metastasis-associated protein 2 (MTA2) plays essential roles in tumorigenesis and aggressiveness of gastric cancer (GC). However, the underlying molecular mechanisms of MTA2-mediated GC and its upstream regulation mechanism remain elusive. In this study, we identified a novel circular RNA (circRNA) generated from the MTA2 gene (circMTA2) as a crucial regulator in GC progression. CircMTA2 was highly expressed in GC tissues and cell lines, and circMTA2 promoted the proliferation, invasion, and metastasis of GC cells both in vitro and in vivo. Mechanistically, circMTA2 interacted with ubiquitin carboxyl-terminal hydrolase L3 (UCHL3) to restrain MTA2 ubiquitination and stabilize MTA2 protein expression, thereby facilitating tumor progression. Moreover, circMTA2 was mainly encapsulated and transported by exosomes to promote GC cell progression. Taken together, these findings uncover that circMTA2 suppresses MTA2 degradation by interacting with UCHL3, thereby promoting GC progression. In conclusion, we identified a cancer-promoting axis (circMTA2/UCHL3/MTA2) in GC progression, which paves the way for us to design and synthesize targeted inhibitors as well as combination therapies.

Keywords: CircRNAs; MTA2; UCHL3; gastric cancer; ubiquitination.


Conflict of interest statement

The authors have no conflict of interest.

Figures

Figure 1
Figure 1
CircMTA2 has higher expression in the GC tissue and cells. (A) circMTA2 screening flowchart. (B) The expression of 11 screened MTA2-derived circRNAs in AGS cells. (C) Genomic location and Sanger sequence validation of circMTA2. (D) qRT-PCR assay indicating the circularization structure of circMTA2. (E) Relative hsa_circ_0022462 expression levels in GC and GES-1 cells. (F) Relative hsa_circ_0022462 expression levels in GC tissues and adjacent normal tissues. (G) qRT-PCR assay indicating the expression of circMTA2 and MTA2 mRNA in AGS cells administered with RNase R or Mock control. (H) RNA FISH assay showing the localization of circMTA2 in AGS and MKN-45 cells. GAPDH was applied as a positive control; Scale: 100×. (I) The subcellular location analysis reveals the distribution of circMTA2 in the cytoplasm and nucleus. All data from three independent experiments shown as mean ± SD. ns p > 0.05, ** p < 0.01; *** p < 0.001.
Figure 2
Figure 2
CircMTA2 promotes the progression of GC cells. (AD) The CCK8 (A), colony formation (B), EdU incorporation; Scale: 20× (C), and transwell assays; Scale: 20× (D) show the cell proliferation/invasion/migration status of GC cells stably transfected with empty vector (LV-NC/sh-NC), LV-circMTA2 (sh-circMTA2). (E) The TUNEL staining indicates the cell apoptosis of GC cells stably transfected with LV-NC/sh-NC and LV-circMTA2 (sh-circMTA2); Scale: 20×. (F) Representative images, growth curve, and weight at the end points of xenografts formed by subcutaneous xenograft of MKN45 cells stably transfected with LV-NC or LV-circMTA2 into the dorsal flanks of nude mice (n = 5 for each group). (G) Representative images (left panel) and quantification (right panel) of immunohistochemical staining revealing the expression of Ki-67 and CD31 within xenografts formed by subcutaneous injection of MKN45 cells stably transfected with LV-NC or LV-circMTA2. The scale bar represents 50 µm. (H) Fluorescence images of mouse lung metastasis model formed by subcutaneous injection of MKN45 cells stably transfected with LV-NC or lv-circMTA2. All data from three independent experiments shown as mean ± SD. * p < 0.05; ** p < 0.01; *** p < 0.001.
Figure 3
Figure 3
CircMTA2 regulates MTA2 expression by controlling its ubiquitination. (A,B) qRT-PCR assay (A) and Western blot (B) analysis indicating the expression of MTA2 mRNA in GC cells stably transfected with LV-NC/sh-NC and LV-circMTA2 (sh-circMTA2). (C) CHX chase analysis showing the half-life of MTA2 protein in GC cells stably transfected with LV-NC/sh-NC and LV-circMTA2 (sh-circMTA2). (D) Western blot analysis indicated the expression of MTA2 in MKN-45 cells stably transfected with sh-NC or sh-circMTA2 and treated with MG132 or CQ. (E) Ubiquitination assay indicating the ubiquitination level of MTA2 in AGS and MKN-45 cells stably transfected with LV-NC/sh-NC and LV-circMTA2 (sh-circMTA2). All data from three independent experiments shown as mean ± SD. ns p > 0.05, * p < 0.05; ** p < 0.01.
Figure 4
Figure 4
CircMTA2 promotes the progression of GC cells by upregulating MTA2 expression. (AD) The CCK-8 (A), colony formation (B), EdU incorporation; Scale: 20× (C), and transwell; Scale: 20× (D) assays showing the cell proliferation/invasion/migration status of GC cells stably transfected with LV-NC/sh-NC and LV-circMTA2 (sh-circMTA2) plus MTA2 knockdown/overexpression (MTA2-KD/MTA2-OE) plasmid. (E) The TUNEL staining indicated the cell apoptosis of GC cells stably transfected with LV-NC/sh-NC and LV-circMTA2 (sh-circMTA2) plus MTA2-KD/MTA2-OE plasmid; Scale: 20×. All data from three independent experiments shown as mean ± SD. ** p < 0.01; *** p < 0.001.
Figure 5
Figure 5
UCHL3 directly combines with MTA2 in GC cells. (A) Coomassie bright blue staining (left panel), Venn diagram (right panel) indicating the differential proteins pulled down by circMTA2, their over-lapping analysis with established deubiquitinase dataset. (B) Results of the ubiquitination level of MTA2 in MKN-45 cells, which were co-transfected with Flag-MTA2, HA-Ub, and one of the three potential DUBs. (C) Immunofluorescence analysis showing the localization of circMTA2 and UCHL3 in GC cells; Scale: 100×. (D) Co-IP analysis indicates the interaction between UCHL3 and MTA2 in GC cells. (E) Western blot analysis indicating the expression of MTA2 in GC cells as indicated. (F) CHX chase analysis showing the half-life of MTA2 protein in GC cells as indicated. (G) MKN-45 cells were co-transfected with Myc-UCHL3 and Flag-MTA2 wildtype or Flag-MTA2 mutants and harvested for IP analysis. All data from three independent experiments shown as mean ± SD. ** p < 0.01; *** p < 0.001.
Figure 6
Figure 6
CircMTA2 promotes MTA2 expression via interacting with UCHL3 in GC cells. (A) Ubiquitination assays of endogenous MTA2 in the lysates from HEK239T cells co-transfected with Flag-MTA2 and Myc-UCHL3 wildtype or Myc-UCHL3 alanine residue mutants. (B) Ubiquitination assays of endogenous MTA2 in the lysates from AGS cells stably transfected as indicated. (C) Ubiquitination assays of endogenous MTA2 in the lysates from MKN-45 cells were stably transfected with an empty vector or a UCHL3 plasmid. (D) Western blot analysis indicating the expression of MTA2 in GC cells stably transfected as indicated. (E) Co-IP analysis indicates the interaction between UCHL3 and MTA2 in GC cells stably transfected with empty vector or LV-circMTA2. (F) Ubiquitination assays of endogenous MTA2 in the lysates from UCHL3 overexpression AGS cells transfected with empty vector, or LV-circMTA2. All data from three independent experiments shown as mean ± SD.
Figure 7
Figure 7
CircMTA2 promotes GC cell progression via incorporation into exosomes. (A) qRT-PCR analysis indicates the expression of circMTA2 in the GC cells medium administered with PBS control, RNase A alone, or RNase A + Triton X-100. (B) NTA analysis showing the size range of exosomes isolated from the supernatant of the culture medium of GES-1, GC cells. (C) Transmission electron microscopy showing the morphology of exosomes isolated from GES-1 and GC cells. (D) Western blot analysis indicates the expression of exosome markers in exosomes isolated from GES-1 and GC cells. (E) qRT-PCR analysis indicating the expression of circMTA2 in exosomes isolated from GES-1 and GC cells. (F) qRT-PCR analysis indicates the expression of circMTA2 in exosomes isolated from MKN-45 cells stably transfected with sh-NC or sh-circMTA2. (G) The uptake diagram of the exosome. (H) Immunofluorescence analysis showing the internalization of fluorescently labeled exosomes in MKN-45 cells; Scale: 20×. (I) The density of exosomes derived from AGS cells administered with DMSO control or GW-4869. (J,K) CCK-8 (J) and transwell (K) assays indicating the cell proliferation of AGS cells were treated with exosomes derived from circMTA2 overexpression MKN45 cells pretreated with DMSO control or GW-4869; Scale: 20×. All data from three independent experiments shown as mean ± SD. ns p > 0.05, * p < 0.05; ** p < 0.01; *** p < 0.001.

References

    1. Smyth E.C., Nilsson M., Grabsch H.I., van Grieken N.C., Lordick F. Gastric cancer. Lancet. 2020;396:635–648. doi: 10.1016/S0140-6736(20)31288-5. - DOI - PubMed
    1. Ajani J.A., D’Amico T.A., Bentrem D.J., Chao J., Cooke D., Corvera C., Das P., Enzinger P.C., Enzler T., Fanta P., et al. Gastric Cancer, Version 2.2022, NCCN Clinical Practice Guidelines in Oncology. J. Natl. Compr. Cancer Netw. 2022;20:167–192. doi: 10.6004/jnccn.2022.0008. - DOI - PubMed
    1. Puliga E., Corso S., Pietrantonio F., Giordano S. Microsatellite instability in Gastric Cancer: Between lights and shadows. Cancer Treat. Rev. 2021;95:102175. doi: 10.1016/j.ctrv.2021.102175. - DOI - PubMed
    1. Kakeji Y., Ishikawa T., Suzuki S., Akazawa K., Irino T., Miyashiro I., Ono H., Suzuki H., Tanabe S., Kadowaki S., et al. A retrospective 5-year survival analysis of surgically resected gastric cancer cases from the Japanese Gastric Cancer Association nationwide registry (2001–2013) Gastric Cancer. 2022;25:1082–1093. doi: 10.1007/s10120-022-01317-6. - DOI - PubMed
    1. Chung H., Ko Y., Lee I.S., Hur H., Huh J., Han S.U., Kim K.W., Lee J. Prognostic artificial intelligence model to predict 5 year survival at 1 year after gastric cancer surgery based on nutrition and body morphometry. J. Cachexia Sarcopenia Muscle. 2023;14:847–859. doi: 10.1002/jcsm.13176. - DOI - PMC - PubMed

MeSH terms