. 2024 Feb 29;25(5):2842.
doi: 10.3390/ijms25052842.

Inhibition of PRMT5/MEP50 Arginine Methyltransferase Activity Causes Cancer Vulnerability in NDRG2low Adult T-Cell Leukemia/Lymphoma

Affiliations

Inhibition of PRMT5/MEP50 Arginine Methyltransferase Activity Causes Cancer Vulnerability in NDRG2low Adult T-Cell Leukemia/Lymphoma

Tomonaga Ichikawa et al. Int J Mol Sci. .

Abstract

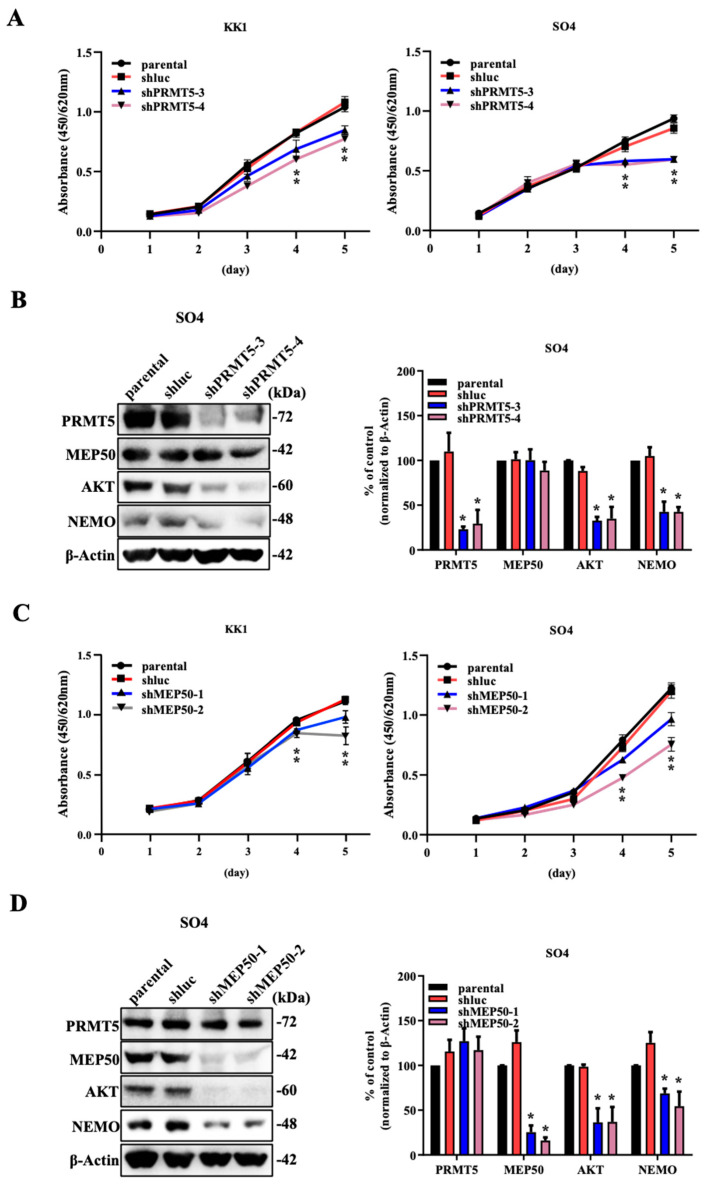
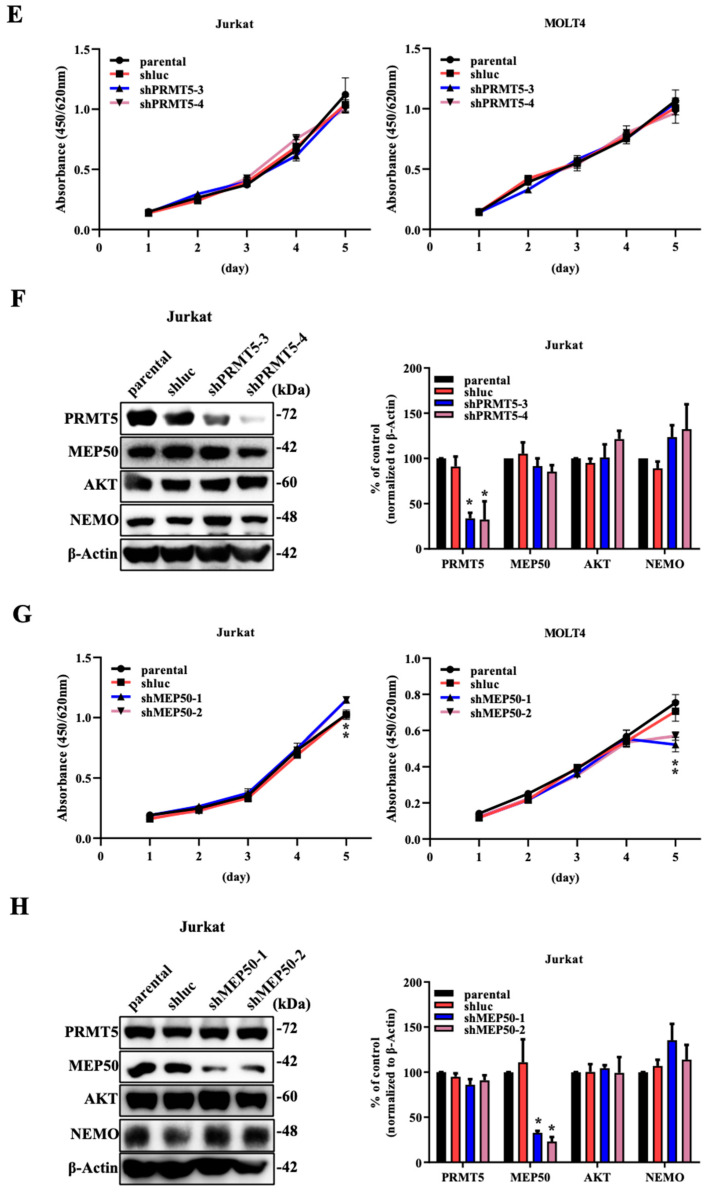
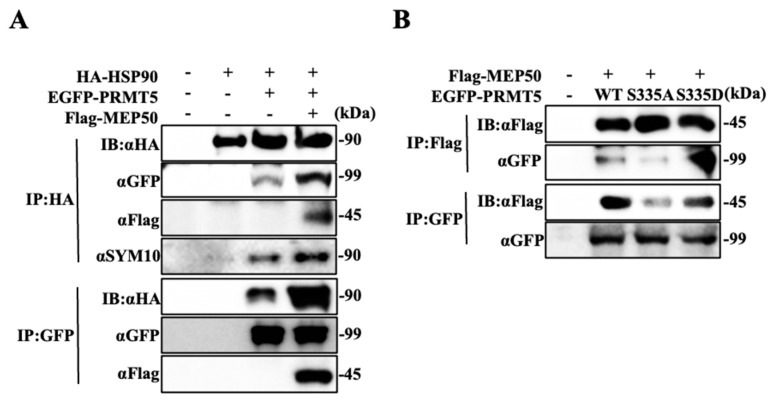
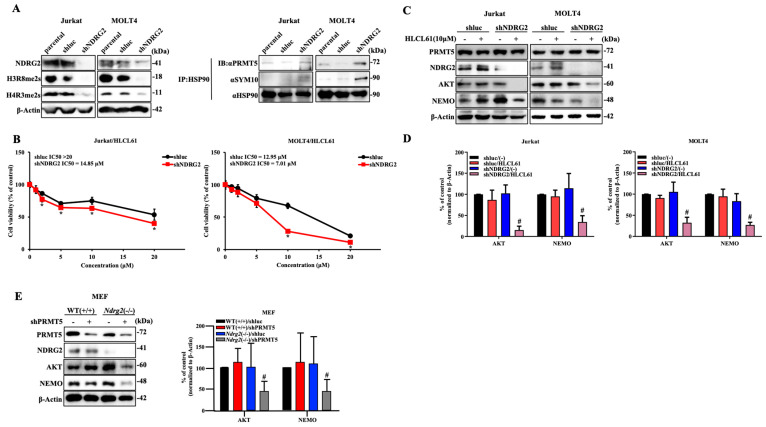
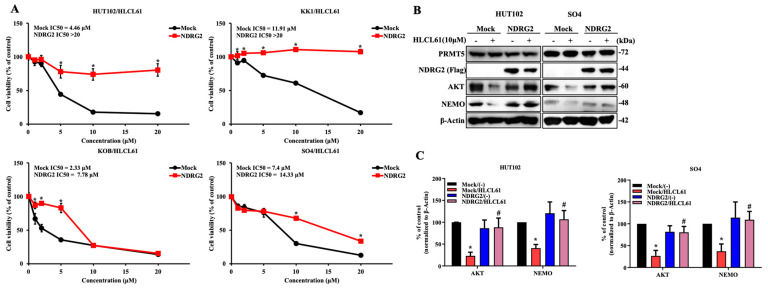
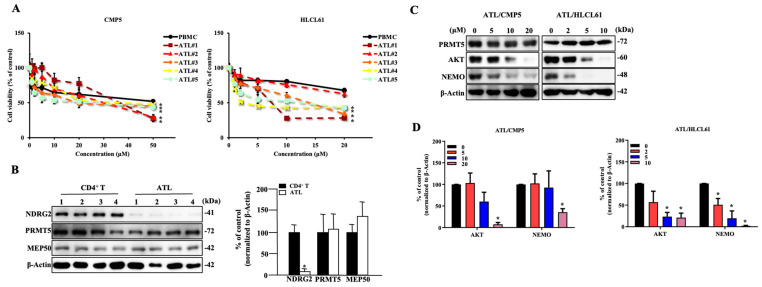
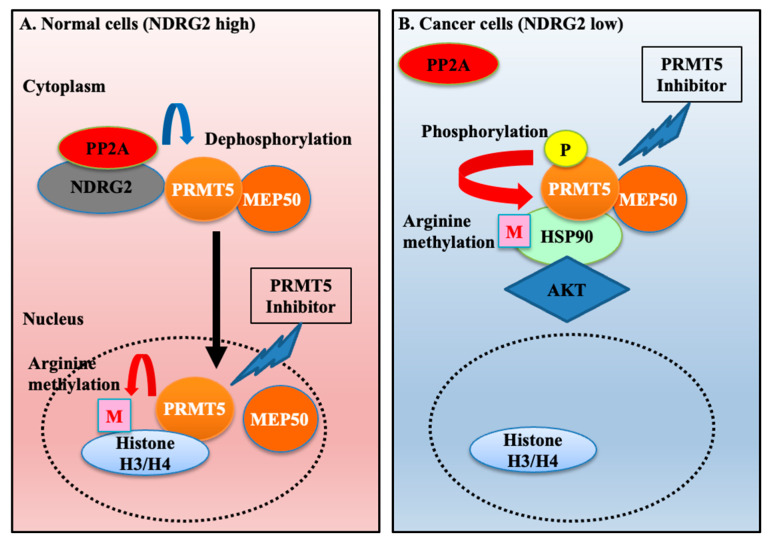
N-myc downstream-regulated gene 2 (NDRG2), which is a tumour suppressor, is frequently lost in many types of tumours, including adult T-cell leukaemia/lymphoma (ATL). The downregulation of NDRG2 expression is involved in tumour progression through the aberrant phosphorylation of several important signalling molecules. We observed that the downregulation of NDRG2 induced the translocation of protein arginine methyltransferase 5 (PRMT5) from the nucleus to the cytoplasm via the increased phosphorylation of PRMT5 at Serine 335. In NDRG2low ATL, cytoplasmic PRMT5 enhanced HSP90A chaperone activity via arginine methylation, leading to tumour progression and the maintenance of oncogenic client proteins. Therefore, we examined whether the inhibition of PRMT5 activity is a drug target in NDRG2low tumours. The knockdown of PRMT5 and binding partner methylsome protein 50 (MEP50) expression significantly demonstrated the suppression of cell proliferation via the degradation of AKT and NEMO in NDRG2low ATL cells, whereas NDRG2-expressing cells did not impair the stability of client proteins. We suggest that the relationship between PRMT5/MEP50 and the downregulation of NDRG2 may exhibit a novel vulnerability and a therapeutic target. Treatment with the PRMT5-specific inhibitors CMP5 and HLCL61 was more sensitive in NDRG2low cancer cells than in NDRG2-expressing cells via the inhibition of HSP90 arginine methylation, along with the degradation of client proteins. Thus, interference with PRMT5 activity has become a feasible and effective strategy for promoting cancer vulnerability in NDRG2low ATL.

Keywords: ATL; MEP50; NDRG2; PRMT5; cancer vulnerability.


Conflict of interest statement

T.M. has financial interests in Denka Co., Ltd. T.I., A.S., S.N., H.I., K.S. and K.M. declare no competing interests in this article.

Figures

Figure 1
Figure 1
The knockdown of PRMT5/MEP50 expression results in the inhibitory effects on ATL with low NDRG2 expression. (A) Cell growth curves of NDRG2low ATL cell lines KK1 and SO4 (parental, shluc, shPRMT5-3, and 4) for five days. The mean and s.d. are shown (n = 4), with *: p < 0.05 compared with parental. (B) Expression of PRMT5, MEP50, AKT, and NEMO in SO4 cells (parental, shluc, shPRMT5-3, and 4) was immunoblotted by each specific antibody. Results are representative of three independent experiments. Bar graphs show the quantification of the relative band intensity normalised to β-actin. The mean and s.d. are shown (n = 3), with * p < 0.05, compared with parental. (C) Cell growth curves of KK1 and SO4 cells (parental, shluc, shMEP50-1, and 2) for five days. The mean and s.d. are shown (n = 4), with *: p < 0.05 compared with parental. (D) Expression of PRMT5, MEP50, AKT, and NEMO in SO4 cells (parental, shluc, shMEP50-1, and 2) was immunoblotted by each specific antibody. Results are representative of three independent experiments. Bar graphs show the quantification of the relative band intensity normalised to β-actin. The mean and s.d. are shown (n = 3), with * p < 0.05, compared with parental. (E) Cell growth curves of NDRG2-expressing T-ALL cell lines Jurkat and MOLT4 (parental, shluc, shPRMT5-3, and 4) for five days. The mean and s.d. are shown (n = 4). (F) Expression of PRMT5, MEP50, AKT, and NEMO in Jurkat cells (parental, shluc, shPRMT5-3, and 4) was immunoblotted by each specific antibody. Results are representative of three independent experiments. Bar graphs show the quantification of the relative band intensity normalised to β-actin. The mean and s.d. are shown (n = 3), with * p < 0.05, compared with parental. (G) Cell growth curves of Jurkat and MOLT4 cells (parental, shluc, shMEP50-1, and 2) for five days. The mean and s.d. are shown (n = 4), with *: p < 0.05 compared with parental. (H) Expression of PRMT5, MEP50, AKT, and NEMO in Jurkat cells (parental, shluc, shMEP50-1, and 2) were immunoblotted by each specific antibody. Results are representative of three independent experiments. Bar graphs show the quantification of the relative band intensity normalised to β-actin. The mean and s.d. are shown (n = 3), with * p < 0.05, compared with parental.
Figure 1
Figure 1
The knockdown of PRMT5/MEP50 expression results in the inhibitory effects on ATL with low NDRG2 expression. (A) Cell growth curves of NDRG2low ATL cell lines KK1 and SO4 (parental, shluc, shPRMT5-3, and 4) for five days. The mean and s.d. are shown (n = 4), with *: p < 0.05 compared with parental. (B) Expression of PRMT5, MEP50, AKT, and NEMO in SO4 cells (parental, shluc, shPRMT5-3, and 4) was immunoblotted by each specific antibody. Results are representative of three independent experiments. Bar graphs show the quantification of the relative band intensity normalised to β-actin. The mean and s.d. are shown (n = 3), with * p < 0.05, compared with parental. (C) Cell growth curves of KK1 and SO4 cells (parental, shluc, shMEP50-1, and 2) for five days. The mean and s.d. are shown (n = 4), with *: p < 0.05 compared with parental. (D) Expression of PRMT5, MEP50, AKT, and NEMO in SO4 cells (parental, shluc, shMEP50-1, and 2) was immunoblotted by each specific antibody. Results are representative of three independent experiments. Bar graphs show the quantification of the relative band intensity normalised to β-actin. The mean and s.d. are shown (n = 3), with * p < 0.05, compared with parental. (E) Cell growth curves of NDRG2-expressing T-ALL cell lines Jurkat and MOLT4 (parental, shluc, shPRMT5-3, and 4) for five days. The mean and s.d. are shown (n = 4). (F) Expression of PRMT5, MEP50, AKT, and NEMO in Jurkat cells (parental, shluc, shPRMT5-3, and 4) was immunoblotted by each specific antibody. Results are representative of three independent experiments. Bar graphs show the quantification of the relative band intensity normalised to β-actin. The mean and s.d. are shown (n = 3), with * p < 0.05, compared with parental. (G) Cell growth curves of Jurkat and MOLT4 cells (parental, shluc, shMEP50-1, and 2) for five days. The mean and s.d. are shown (n = 4), with *: p < 0.05 compared with parental. (H) Expression of PRMT5, MEP50, AKT, and NEMO in Jurkat cells (parental, shluc, shMEP50-1, and 2) were immunoblotted by each specific antibody. Results are representative of three independent experiments. Bar graphs show the quantification of the relative band intensity normalised to β-actin. The mean and s.d. are shown (n = 3), with * p < 0.05, compared with parental.
Figure 2
Figure 2
Hyperphosphorylated PRMT5 binds to MEP50 and promotes HSP90 arginine methylation. (A) The lysates of 293T cells transfected with HA-tagged HSP90, EGFP-tagged PRMT5, and/or Flag-tagged MEP50 were immunoprecipitated with anti-HA or anti-GFP antibody, and immunoprecipitates were assayed by western blotting with the indicated antibodies. (B) EGFP-tagged wild-type or mutated PRMT5 (S335A and S335D) was co-transfected with Flag-tagged MEP50. The cell lysates were immunoprecipitated with anti-GFP or anti-Flag antibodies and subsequently immunoblotted with each indicated antibody.
Figure 3
Figure 3
NDRG2low ATL cells are sensitive to PRMT5 inhibitors. (A) Cell viability and IC50 were determined after treatment with 0–50 μM CMP5 and 0–20 μM HLCL61 at 120 h in T-ALL, HTLV-1-infected, and ATL cell lines. (B) Expression of PRMT5, HSP90, AKT, and NEMO in HUT102, SO4, Jurkat, and MOLT4 cells after treatment with the indicated doses of HLCL61 for 24 h was determined via immunoblot analysis using each specific antibody. Results are representative of three independent experiments. (C) Bar graphs show the quantification of the relative band intensity normalised to β-actin. The mean and s.d. are shown (n = 3), with * p < 0.05, compared with 0. (D) HSP90 immunoprecipitated from HUT102 and SO4 cells treated with the indicated doses of HLCL61 for 24 h was analysed via immunoblotting using the indicated antibodies.
Figure 4
Figure 4
Knockdown of NDRG2 expression in T-ALL cells enhances sensitivity to PRMT5 inhibitors. (A) Expression of NDRG2, H3R8me2s, and H4R3me2s in Jurkat and MOLT4 cells (parental, shluc, and shNDRG2) was immunoblotted using each specific antibody. HSP90 immunoprecipitated from Jurkat and MOLT4 cells was analysed via immunoblotting using the indicated antibodies. (B) Cell viability and IC50 were determined after treatment with 0–20 μM HLCL61 at 120 h in Jurkat and MOLT4 cells (shluc and shNDRG2). The mean and s.d. are shown (n = 4), with *: p < 0.05 compared with shluc. (C) Expression of PRMT5, NDRG2, AKT, and NEMO in Jurkat and MOLT4 cells (shluc and shNDRG2) after treatment with 10 μM HLCL61 for 24 h was determined via immunoblot analysis using each specific antibody. Results are representative of three independent experiments. (D) Bar graphs show the quantification of the relative band intensity normalised to β-actin. The mean and s.d. are shown (n = 3), with # p < 0.05, compared with shluc/HLCL61. (E) Whole-cell lysates from MEFs of WT(+/+) and Ndrg2(−/−) mice after PRMT5 knockdown were subjected to western blotting using the indicated antibodies. Results are representative of three independent experiments. Bar graphs show the quantification of the relative band intensity normalised to β-actin. The mean and s.d. are shown (n = 3), with # p < 0.05, compared with WT(+/+)/shPRMT5.
Figure 5
Figure 5
The enhanced expression of NDRG2 attenuates the anti-tumour effects of PRMT5 inhibitors in ATL and solid cancer cells. (A) Cell viability and IC50 were determined after treatment with 0–20 μM HLCL61 at 120 h in HUT102 and SO4 cells (Mock and NDRG2). The mean and s.d. are shown (n = 4), with *: p < 0.05 compared with Mock. (B) Expression of PRMT5, NDRG2 (Flag), AKT, and NEMO in HUT102, KOB, KK1, and SO4 cells (Mock and NDRG2) after treatment with 10 μM HLCL61 for 24 h was determined via immunoblot analysis. Results are representative of three independent experiments. (C) Bar graphs show the quantification of the relative band intensity normalised to β-actin. The mean and s.d. are shown (n = 3), with * p < 0.05, compared with Mock/(-) and # p < 0.05, compared with Mock/HLCL61.
Figure 6
Figure 6
PRMT5 inhibitors are effective against NDRG2low ATL patient cells. (A) Cell viability and IC50 were determined after treatment with 0–50 μM CMP5 and 0–20 μM HLCL61 at 120 h in PBMCs and patient-derived ATL cells. The mean and s.d. are shown (n = 4), with *: p < 0.05 compared to PBMCs. (B) Western blot analysis of NDRG2, PRMT5, and MEP50 was performed in the CD4+ T-cells from healthy volunteers (CD4+ T) served as the controls and patient-derived ATL cells. Bar graphs show the quantification of the relative band intensity normalised by β-actin in CD4+ T and ATL. The mean and s.d. are shown (n = 4), with * p < 0.05, compared to CD4+ T. (C) Expression of PRMT5, AKT, and NEMO in ATL cells after treatment with the indicated doses of CMP5 and HLCL61 for 24 h was determined via immunoblot analysis. Results are representative of three independent experiments. (D) Bar graphs show the quantification of the relative band intensity normalised to β-actin. The mean and s.d. are shown (n = 3), with * p < 0.05, compared with 0.
Figure 7
Figure 7
Scheme of cancer vulnerability between the downregulation of NDRG2 and cytoplasmic PRMT5/MEP50 activity in NDRG2low cancer cells. (A) Hypophosphorylated PRMT5 via the recruitment of NDRG2/PP2A is translocated to the nucleus, leading to the induction of histone arginine methylation in NDRG2-expressing cells to participate in gene expression and several physiological processes. Therefore, treatment of PRMT5-specific inhibitors does not induce anti-cancer effects. (B) Highly phosphorylated PRMT5 firmly associates with MEP50 and HSP90 in NDRG2low cancer cells, leading to the enhancement of HSP90 arginine methylation and chaperone activity. Thus, interference with cytoplasmic PRMT5/MEP50 activity causes cancer vulnerability, followed by the inhibition of tumorigenesis.

Similar articles

Cited by

References

    1. Iwanaga M. Epidemiology of HTLV-1 Infection and ATL in Japan: An Update. Front. Microbiol. 2020;11:1124. doi: 10.3389/fmicb.2020.01124. - DOI - PMC - PubMed
    1. Einsiedel L., Pham H., Talukder M.R.R., Liddle J., Taylor K., Wilson K., Jersmann H., Gessain A., Woodman R., Kaldor J. Pulmonary Disease Is Associated With Human T-Cell Leukemia Virus Type 1c Infection: A Cross-sectional Survey in Remote Aboriginal Communities. Clin. Infect. Dis. 2020;73:e1498–e1506. doi: 10.1093/cid/ciaa1401. - DOI - PubMed
    1. Kataoka K., Nagata Y., Kitanaka A., Shiraishi Y., Shimamura T., Yasunaga J., Totoki Y., Chiba K., Sato-Otsubo A., Nagae G., et al. Integrated molecular analysis of adult T cell leukemia/lymphoma. Nat. Genet. 2015;47:1304–1315. doi: 10.1038/ng.3415. - DOI - PubMed
    1. Cook L.B., Phillips A.A. How I treat adult T-cell leukemia/lymphoma. Blood. 2021;137:459–470. doi: 10.1182/blood.2019004045. - DOI - PubMed
    1. Ichikawa T., Nakahata S., Fujii M., Iha H., Shimoda K., Morishita K. The regulation of NDRG2 expression during ATLL development after HTLV-1 infection. Biochim. Biophys. Acta (BBA)-Mol. Basis Dis. 2019;1865:2633–2646. doi: 10.1016/j.bbadis.2019.07.001. - DOI - PubMed

MeSH terms

Substances