. 2024 Mar 1;25(5):2856.
doi: 10.3390/ijms25052856.

Lack of the Histone Deacetylase SIRT1 Leads to Protection against Endoplasmic Reticulum Stress through the Upregulation of Heat Shock Proteins

Affiliations

Lack of the Histone Deacetylase SIRT1 Leads to Protection against Endoplasmic Reticulum Stress through the Upregulation of Heat Shock Proteins

Jessica Latorre et al. Int J Mol Sci. .

Abstract

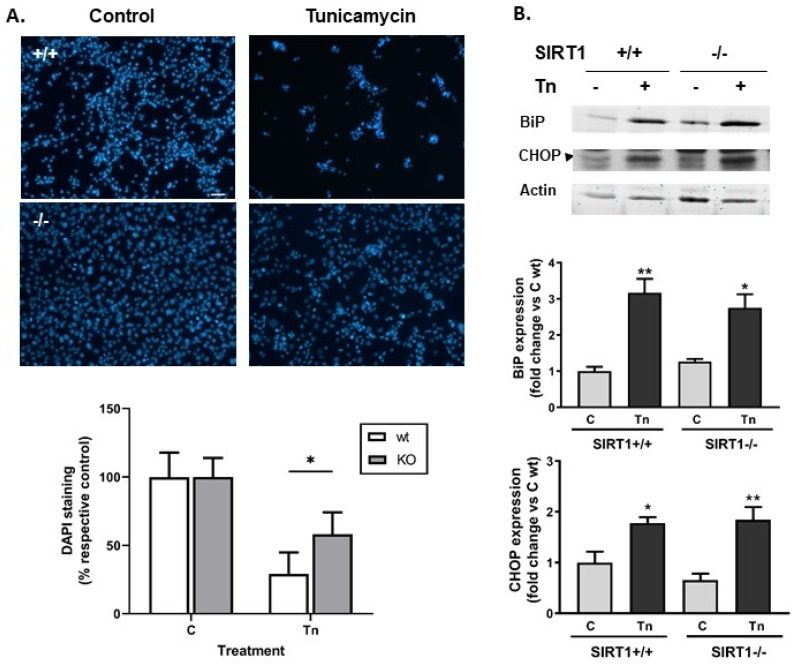
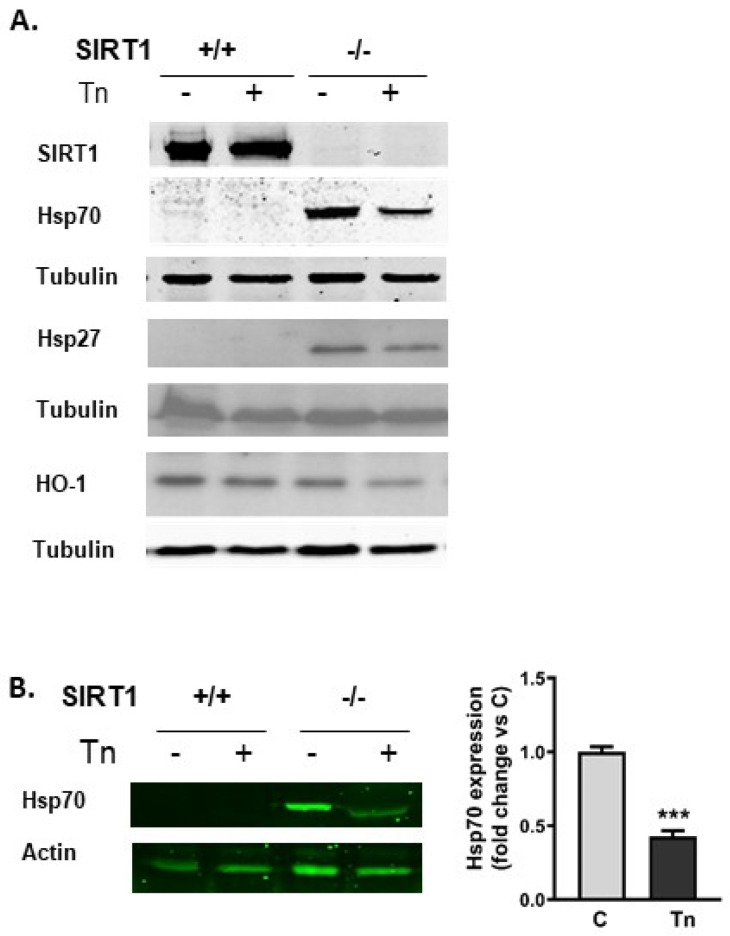
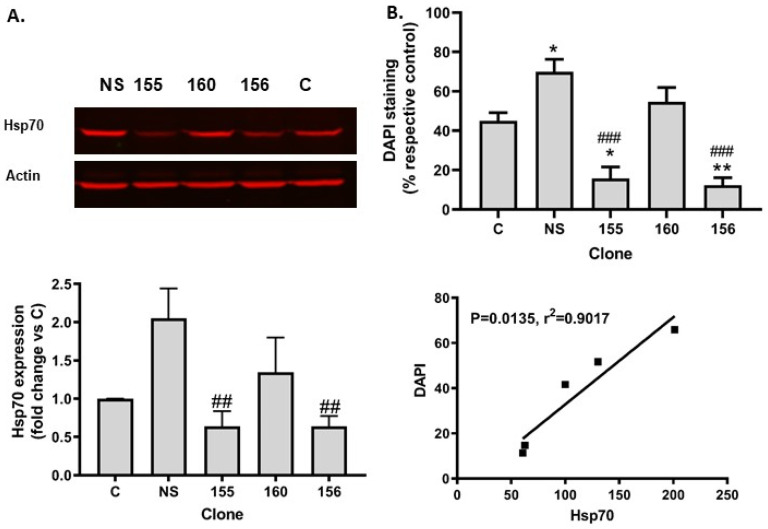
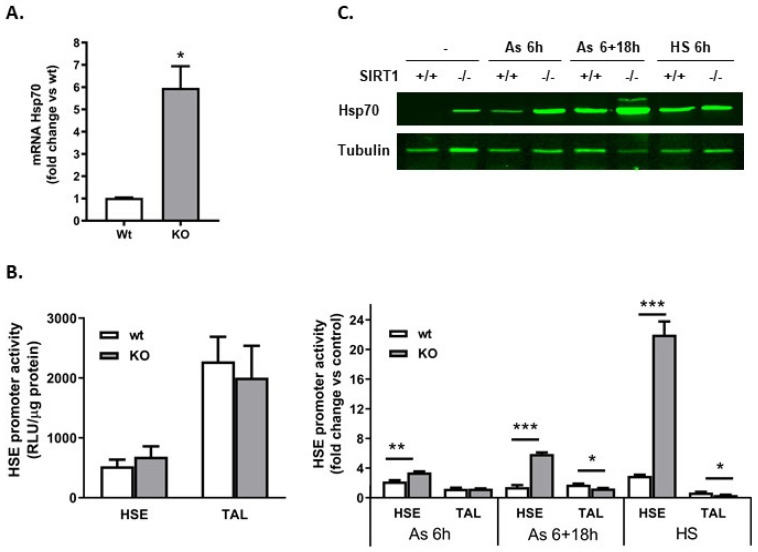
Histone deacetylase SIRT1 represses gene expression through the deacetylation of histones and transcription factors and is involved in the protective cell response to stress and aging. However, upon endoplasmic reticulum (ER) stress, SIRT1 impairs the IRE1α branch of the unfolded protein response (UPR) through the inhibition of the transcriptional activity of XBP-1 and SIRT1 deficiency is beneficial under these conditions. We hypothesized that SIRT1 deficiency may unlock the blockade of transcription factors unrelated to the UPR promoting the synthesis of chaperones and improving the stability of immature proteins or triggering the clearance of unfolded proteins. SIRT1+/+ and SIRT1-/- fibroblasts were exposed to the ER stress inducer tunicamycin and cell survival and expression of heat shock proteins were analyzed 24 h after the treatment. We observed that SIRT1 loss significantly reduced cell sensitivity to ER stress and showed that SIRT1-/- but not SIRT1+/+ cells constitutively expressed high levels of phospho-STAT3 and heat shock proteins. Hsp70 silencing in SIRT1-/- cells abolished the resistance to ER stress. Furthermore, accumulation of ubiquitinated proteins was lower in SIRT1-/- than in SIRT1+/+ cells. Our data showed that SIRT1 deficiency enabled chaperones upregulation and boosted the proteasome activity, two processes that are beneficial for coping with ER stress.

Keywords: ER stress; Hsp70; STAT3; sirtuin.


Conflict of interest statement

The authors declare that they have no conflicts of interest with the contents of this article.

Figures

Figure 1
Figure 1
SIRT1−/− MEFs were more resistant to tunicamycin-induced death than SIRT1+/+ MEFs. (A). Representative microphotographs of cells stained with DAPI 24 h after the treatment with 3 μM tunicamycin. Scale bar 100 μm. Graph: quantitative representation of surviving cells after the lesion. Nuclei stained with DAPI were counted and expressed as a % of respective control. Results are mean ± SEM, n = 5–7 cultures, * p < 0.05. (B). Western blot of BiP and CHOP after tunicamycin treatment in wt and SIRT1 KO cells. Arrowhead indicates the band corresponding to CHOP. Other bands are not specific. Semi-quantitative analysis of BiP and CHOP was determined by calculating the ratio of the protein of interest to actin. Results from 3 different experiments are expressed as mean ± SEM. * p < 0.05, ** p < 0.01 indicate statistical significance vs. respective control.
Figure 2
Figure 2
SIRT1 deficiency induced the expression of heat shock proteins. (A). Western blot of SIRT1, Hsp70, Hsp27 and HO-1 in wt and SIRT1 KO cells show that Hsp70 and Hsp27 were not expressed in SIRT1+/+ but constitutively synthesized in SIRT1−/− cells. HO-1 was similarly expressed in wt and SIRT1 KO cells. Tunicamycin reduced Hsp70 expression in SIRT1−/− cells. (B). Western blot and quantitative analysis of Hsp70 after tunicamycin treatment in SIRT1−/− cells. Results were measured as the ratio of Hsp70 to actin and expressed as mean ± SEM (n = 3) *** p < 0.001.
Figure 3
Figure 3
Hsp70 silencing in SIRT1-deficient cells abolished resistance to tunicamycin toxicity (A). Western blot of Hsp70 in the control SIRT1 KO cell line and in the stable polyclonal cell lines expressing non-silencing RNA (NS) or 3 different Hsp70 shRNA (155, 156 and 160). Top: representative blot of Hsp70 expression. Bottom graph: quantitative representation of Hsp70 expression. Results are mean ± SEM, n = 4–5. Note that only shRNA 155 and 156 efficiently repressed Hsp70 synthesis. (B). Quantitative analysis of surviving cells 24 h after tunicamycin treatment. Top graph: DAPI+ cells were counted and expressed as % of respective control cells. Results are mean ± SEM, n = 4–5. Bottom graph: linear regression analysis shows that protein levels of Hsp70 correlated with cell resistance to tunicamycin toxicity. * p < 0.05, ** p < 0.01 vs. control; ## p < 0.01, ### p < 0.001 vs. NS.
Figure 4
Figure 4
Hsp70 was upregulated in SIRT1 KO cells. Transcriptional activation of HSE was not involved in the effect. (A) Quantitative RT-PCR of Hsp70. SIRT1+/+ and SIRT1−/− cells were scrapped in basal conditions and processed for mRNA determination using SYBRGreen. Hsp70 mRNA levels were normalized with L14. Results calculated as fold change vs. wt are presented as mean ± SEM. n = 4, * p < 0.05. (B) HSE basal activity was similar in wt and KO cells, but upon stress conditions, the HSE promoter activity was stronger and lasted longer in KO than in wt cells. MEFs were transfected with pTAL or pHSE plasmids and 48 h later, cells were lyzed and luciferase activity was monitored. Results, calculated as RLU/µg protein, are expressed as mean ± SEM (left graph, n = 3). Sister cultures were either incubated at 42 °C (HS) or with arsenite (As) for 6 h or 6 h + 18 h recovery and processed for luciferase activity (right graph). Results, calculated as fold increase vs. respective control, are expressed as mean ± SEM (n = 3). * p < 0.05, ** p < 0.01 and *** p < 0.001. (C) Western blot of Hsp70 after chemical stress (As) or heat shock (HS) treatments performed as in (B).
Figure 5
Figure 5
STAT3 was constitutively phosphorylated and accumulated in the nucleus of SIRT1−/− cells. It was recruited to Hsp70 and Socs-3 promoters. (A) Western blot of STATs proteins in basal conditions showing that STAT3 was upregulated in SIRT1−/− cells. In addition, P-STAT3Tyr705 was present only in SIRT1 KO cells. Graph: quantitative expression of STAT1, STAT3 and P-STAT3. Results are mean ± SEM, n = 4. * p < 0.05. (B) Western blot of P-STAT3Tyr705 after tunicamycin treatment (Tn). Cells were collected 24h after Tn addition and processed for western blot. (C) Immunofluorescence showed STAT3 accumulation in the nucleus of SIRT1−/− but not in SIRT1+/+ MEFs in basal conditions. Scale bar 20 µm. qRT-PCR showed that Socs-3 expression was significantly higher in SIRT1−/− than in SIRT1+/+ cells. Results calculated as fold change vs. wt are presented as mean ± SEM, n = 4. * p < 0.05 vs. wt. (D) Chromatin immunoprecipitation analysis of Hsp70 and Socs-3 promoters was carried out in SIRT1+/+ and SIRT1−/− MEFs. Chromatin was immunoprecipitated with anti-P-STAT3/anti-STAT3 antibodies or rabbit IgG serum, DNA was amplified with primers that bound to the region between −143 and +4 bp (that overlapped the putative STAT3 binding site) on the Hsp70 promoter or with primers that bound to the region between −1247 and −1039 bp on the Socs-3 promoter. The amplification with primer pairs that bound to the region between −1164 bp and −1001 bp on the Hsp70 promoter were used to normalize the data. Results are expressed as a percentage of input for the negative antibody (IgG) and the antibodies of interest (P-STAT3/STAT3) (a,c), and fold enrichment normalized to a region far away (−1164 to −1001) from the initiation transcription site on the Hsp70 promoter (b,d). Results are mean ± SEM, n = 4. * p < 0.05.

Similar articles

Cited by

References

    1. Giblin W., Skinner M.E., Lombard D.B. Sirtuins: Guardians of Mammalian Healthspan. Trends Genet. 2014;30:271–286. doi: 10.1016/j.tig.2014.04.007. - DOI - PMC - PubMed
    1. Kwon H.S., Ott M. The Ups and Downs of SIRT1. Trends Biochem. Sci. 2008;33:517–525. doi: 10.1016/j.tibs.2008.08.001. - DOI - PubMed
    1. Pantazi E., Zaouali M.A., Bejaoui M., Serafin A., Folch-Puy E., Petegnief V., De Vera N., Ben Abdennebi H., Rimola A., Rosello-Catafau J. Silent Information Regulator 1 Protects the Liver against Ischemia-Reperfusion Injury: Implications in Steatotic Liver Ischemic Preconditioning. Mol. Neurobiol. 2014;27:493–503. doi: 10.1111/tri.12276. - DOI - PubMed
    1. Donmez G. The Neurobiology of Sirtuins and Their Role in Neurodegeneration. Trends Pharm. Sci. 2012;33:494–501. doi: 10.1016/j.tips.2012.05.007. - DOI - PubMed
    1. Zhang W., Xiao D., Li X., Zhang Y., Rasouli J., Casella G., Boehm A., Hwang D., Ishikawa L.L., Thome R., et al. SIRT1 Inactivation Switches Reactive Astrocytes to an Antiinflammatory Phenotype in CNS Autoimmunity. J. Clin. Investig. 2022;132:e151803. doi: 10.1172/JCI151803. - DOI - PMC - PubMed

MeSH terms