. 2024 Mar 1;25(5):2863.
doi: 10.3390/ijms25052863.

Exploring the Molecular Tapestry: Organ-Specific Peptide and Protein Ultrafiltrates and Their Role in Therapeutics

Affiliations

Exploring the Molecular Tapestry: Organ-Specific Peptide and Protein Ultrafiltrates and Their Role in Therapeutics

Jakub Peter Slivka et al. Int J Mol Sci. .

Abstract

This study aims to characterize the proteome composition of organ-derived protein extracts from rabbits. Protein isolation was performed using soft homogenization and size exclusion via ultrafiltration. The proteome analysis of the ultrafiltrates was conducted using gel electrophoresis, and the mass spectrometry data were subjected to gene ontology analysis. Proteomic profiling revealed comprehensive protein profiles associated with RNA regulation, fatty acid binding, inflammatory response, oxidative stress, and metabolism. Additionally, our results demonstrate the presence of abundant small proteins, as observed in the mass spectrometry datasets. Small proteins and peptides are crucial in transcription modulation and various biological processes. The protein networks identified in the ultrafiltrates have the potential to enhance and complement biological therapeutic interventions. Data are available via ProteomeXchange with identifier PXD050039.

Keywords: organ specificity; proteomics; small proteins; ultrafiltration.


Conflict of interest statement

Authors affiliated with the European Wellness Academy and European Wellness International are not involved in formal analysis and investigation. The authors have no other relevant affiliations or financial involvement with any organization or entity with a financial interest in or financial conflict with the subject matter or materials discussed in the manuscript apart from those disclosed.

Figures

Figure 1
Figure 1
Tris-Tricine-PAGE of OSPs obtained from ultrafiltration: (a) intercostal muscle (IM) and kidney (KI), runs 9J, 10J, and 11J, two lanes were cut (represented with a gap in the gel picture) from the picture due to the samples not being a part of this experiment; (b) lung (LU), liver (LI), and organ mixture (OM), runs 9J, 10J, and 11J; (c) Tris-Tricine-PAGE of liver tissue extracts obtained by microfiltration (MF: MWCO 0.2 um) and different ultrafiltration (UF1: MWCO 50 kDa, UF2: MWCO 10 kDa); (d) number of proteins/peptides selected by the different selection procedures (right).
Figure 1
Figure 1
Tris-Tricine-PAGE of OSPs obtained from ultrafiltration: (a) intercostal muscle (IM) and kidney (KI), runs 9J, 10J, and 11J, two lanes were cut (represented with a gap in the gel picture) from the picture due to the samples not being a part of this experiment; (b) lung (LU), liver (LI), and organ mixture (OM), runs 9J, 10J, and 11J; (c) Tris-Tricine-PAGE of liver tissue extracts obtained by microfiltration (MF: MWCO 0.2 um) and different ultrafiltration (UF1: MWCO 50 kDa, UF2: MWCO 10 kDa); (d) number of proteins/peptides selected by the different selection procedures (right).
Figure 2
Figure 2
Venn diagram comparing the identified proteins (a) in at least one tissue of the four experiments with a total number of proteins measured is 393; (b) of the same tissues (liver, lung, intercostal muscle, organ Mixture, and kidney) between the experiments.
Figure 3
Figure 3
Cellular compartments of the fractioned proteins of OSPs.
Figure 4
Figure 4
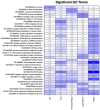
Matrix with −log10 p-values for significantly identified GO terms (p-value < 10−5) for the different tissues of the new dataset. Columns show the different organs/tissues; rows show the GO terms. Columns are ordered by organ/tissue. For the GO analysis, we used differentially regulated proteins (absolute fold change > 2) in any of the tissues.
Figure 5
Figure 5
Matrix with −log10 p-values for significantly identified KEGG pathways (pFDR < 10−3) for the different samples from the new dataset. Columns show the different organs/tissues; rows show the pathways. We used all pathways with a pFDR value < 0.001 in any of the tissues.
Figure 6
Figure 6
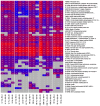
Comparison of OSP abundance with (a) heatmap of the top 50 proteins with the highest differences between the tissue of the liver and the other tissues. We only considered proteins measured in at least 50% of the liver samples and 33% of the other samples. The grey color indicates missing values (protein was not measured). Clustering and coloring are based on the log-transformed LFQ intensities. We annotated the LFQ intensities (in millions) without logarithmic transformation in the cells for better interpretability. (b) MA plot of quantifications (LFQ intensities after logarithmic transform) of tissue: liver. The top 10 proteins (with the highest difference) are annotated.
Figure 7
Figure 7
Comparison of OSP abundance with (a) heatmap of the top 50 proteins with the highest differences between tissue of the lung and the other tissues. We only considered proteins measured in at least 50% of the lung samples and 33% of the other samples. The grey color indicates missing values (protein was not measured). Clustering and coloring are based on the log-transformed LFQ intensities. For better interpretability, we annotated the LFQ intensities (in millions) without logarithmic transformation in the cells; (b) MA plot of quantifications (LFQ intensities after logarithmic transform) of tissue from the lung. The top 10 proteins (with the highest difference) are annotated.
Figure 8
Figure 8
Comparison of OSP abundance with (a) heatmap of the top 50 proteins with the highest differences between tissue of IM and the other tissues. We only considered proteins measured in at least 50% of the IM and 33% of the other samples. The grey color indicates missing values (protein was not measured). Clustering and coloring are based on the log-transformed LFQ intensities. We annotated the LFQ intensities (in millions) without logarithmic transformation in the cells for better interpretability. (b) MA plot of quantifications for intercostal muscle (LFQ intensities after logarithmic transform) of tissue from intercostal muscle. The top 10 proteins (with the highest difference) are annotated.
Figure 9
Figure 9
Comparison of OSP abundance with (a) heatmap of the top 50 proteins with the highest differences between tissue from kidney and the other tissues. We only considered proteins measured in at least 50% of the kidney samples and 33% of the other samples. The grey color indicates missing values (protein was not measured). Clustering and coloring are based on the log-transformed LFQ intensities. We annotated the LFQ intensities (in millions) without logarithmic transformation in the cells for better interpretability. (b) MA plot of quantifications (LFQ intensities after logarithmic transform) of tissue from the kidney. The top 10 proteins (with the highest difference) are annotated.
Figure 10
Figure 10
Comparison of OSP abundance with (a) heatmap of the top 50 proteins with the highest differences between tissue from OM and the other tissues. We only considered proteins measured in at least 50% of the OM samples and 33% of the others. The grey color indicates missing values (protein was not measured). Clustering and coloring are based on the log-transformed LFQ intensities. We annotated the LFQ intensities (in millions) without logarithmic transformation in the cells for better interpretability. (b) MA plot of quantifications (LFQ intensities after logarithmic transform) of tissue from OM. The top 10 proteins (with the highest difference) are annotated.
Figure 11
Figure 11
Heatmap of the top 50 small proteins (under 150aa) with their expression rates shown.

Similar articles

References

    1. Steinberg R., Koch H.G. The Largely Unexplored Biology of Small Proteins in Pro- and Eukaryotes. FEBS J. 2021;288:7002–7024. doi: 10.1111/febs.15845. - DOI - PubMed
    1. Malavolta L., Cabral F.R. Peptides: Important Tools for the Treatment of Central Nervous System Disorders. Neuropeptides. 2011;45:309–316. doi: 10.1016/j.npep.2011.03.001. - DOI - PubMed
    1. Wang L., Wang N., Zhang W., Cheng X., Yan Z., Shao G., Wang X., Wang R., Fu C. Therapeutic Peptides: Current Applications and Future Directions. Signal Transduct. Target. Ther. 2022;7:48. doi: 10.1038/s41392-022-00904-4. - DOI - PMC - PubMed
    1. Morozov G.V.K. Khavinson Natural and Synthetic Thymic Peptides as Therapeutics for Immune Dysfunction. Int. J. Immunopharmacol. 1997;19:501–505. doi: 10.1016/S0192-0561(97)00058-1. - DOI - PubMed
    1. Bhat Z.F., Bhat H.F., Kumar S. Bioactive Peptides of Animal Origin. Rev. J. Food Sci. Technol. 2015;52:5377–5392. doi: 10.1007/s13197-015-1731-5. - DOI - PMC - PubMed

LinkOut - more resources