. 2024 Mar 1;25(5):2882.
doi: 10.3390/ijms25052882.

Brain-Region-Specific Genes Form the Major Pathways Featuring Their Basic Functional Role: Their Implication in Animal Chronic Stress Model

Affiliations

Brain-Region-Specific Genes Form the Major Pathways Featuring Their Basic Functional Role: Their Implication in Animal Chronic Stress Model

Vladimir Babenko et al. Int J Mol Sci. .

Abstract

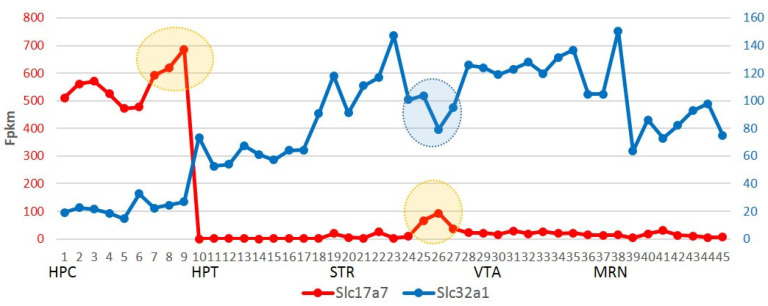
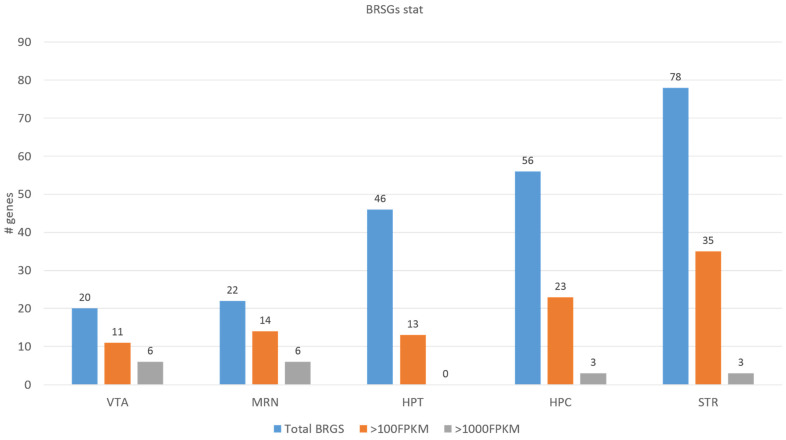
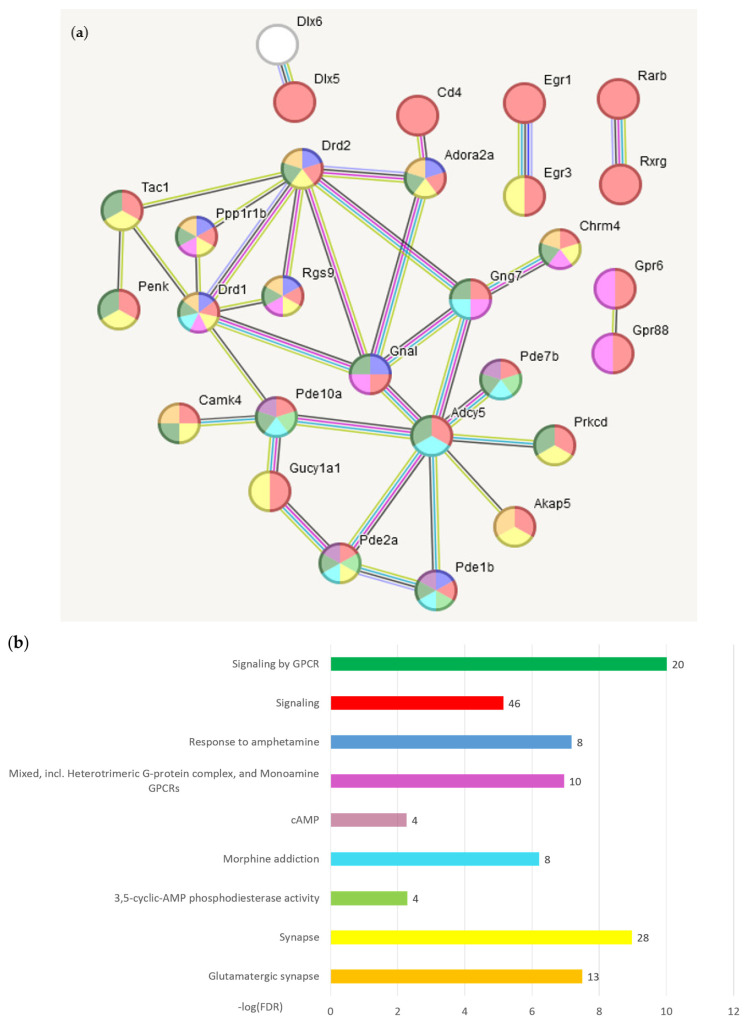
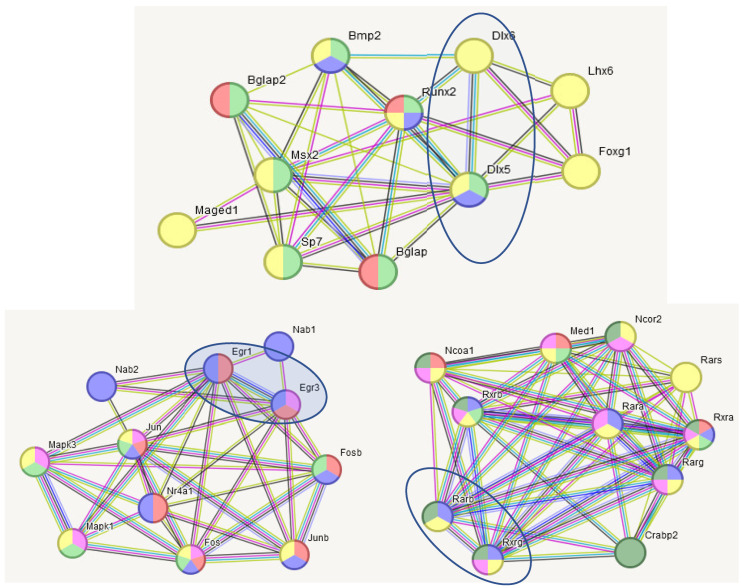
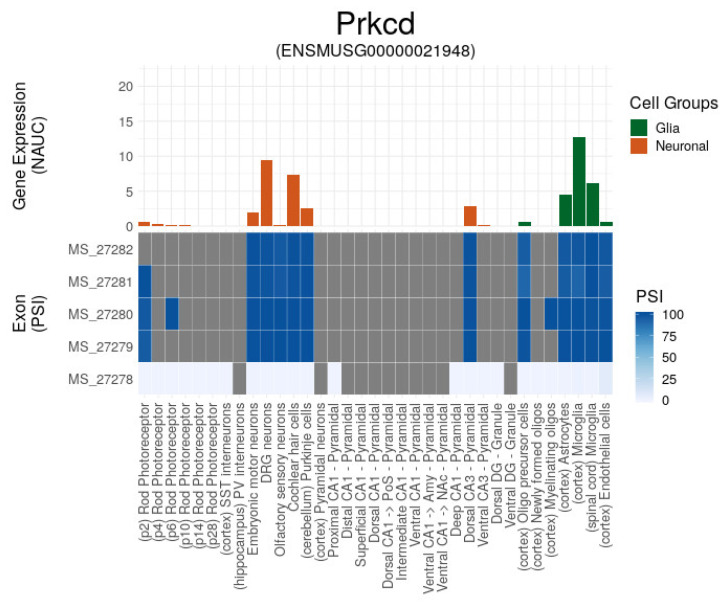
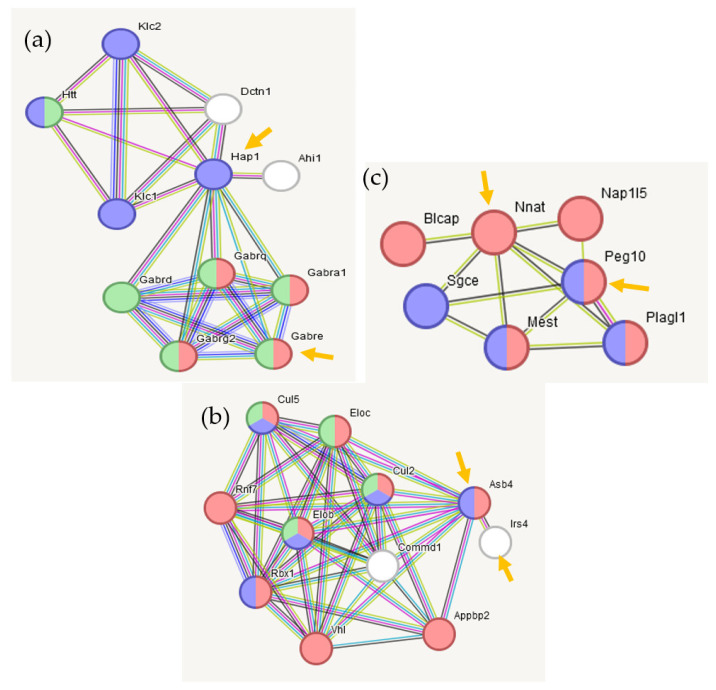
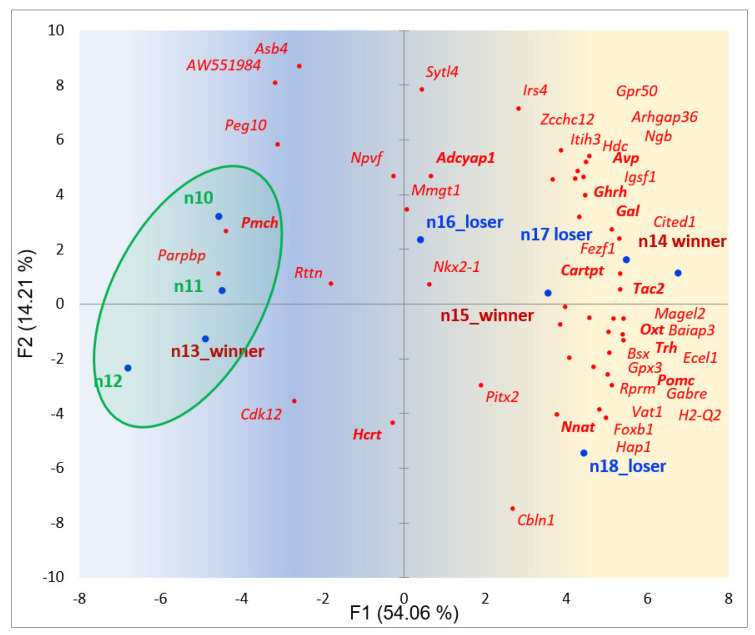
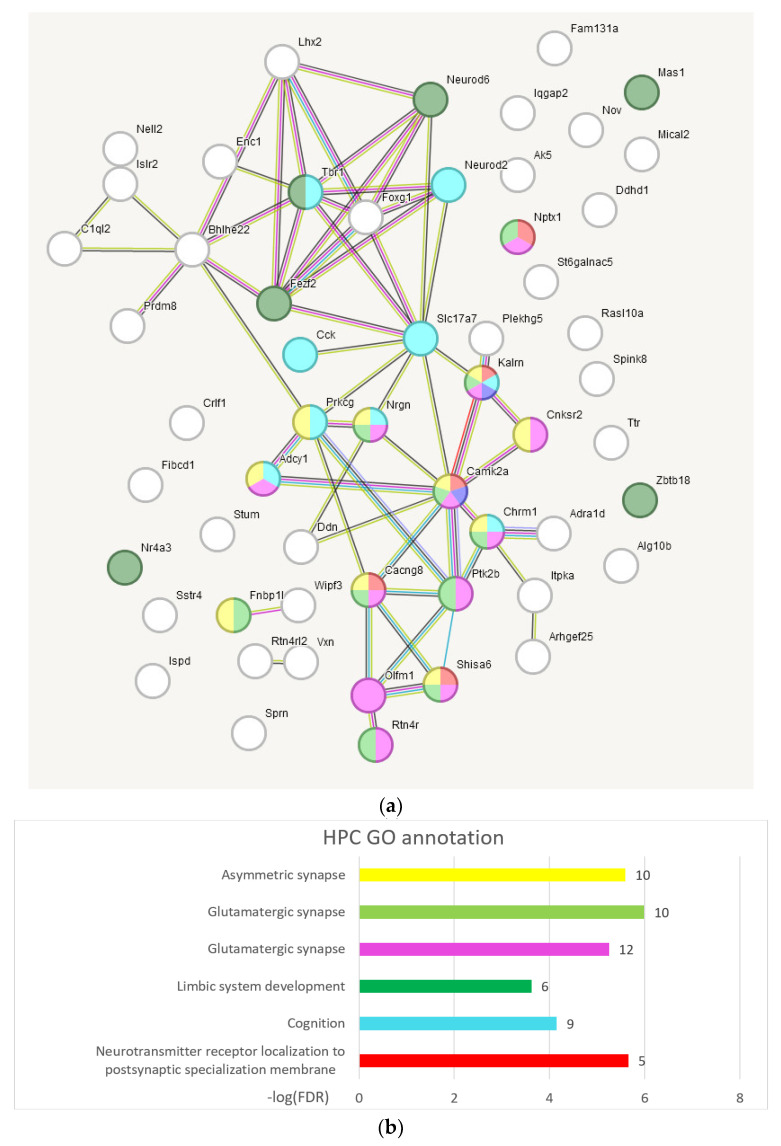
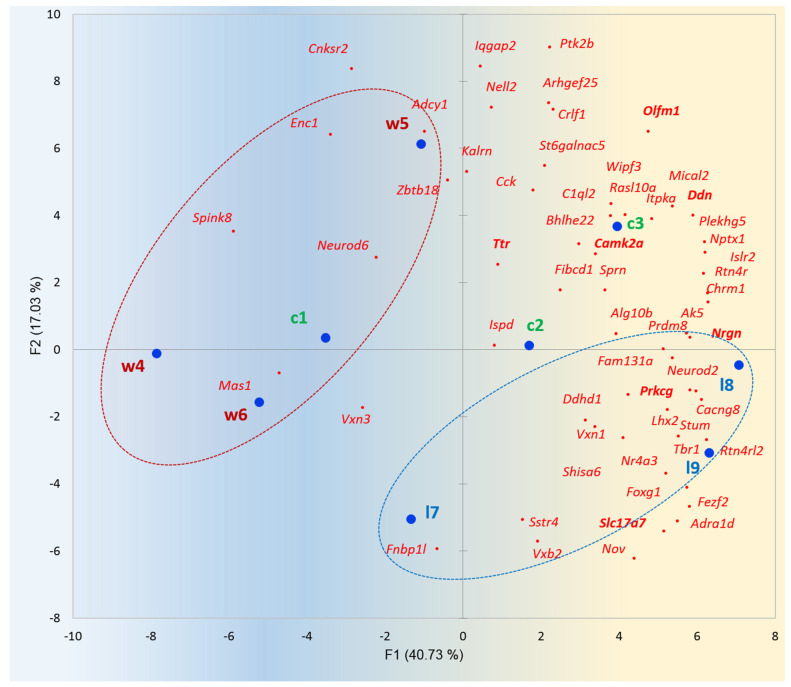
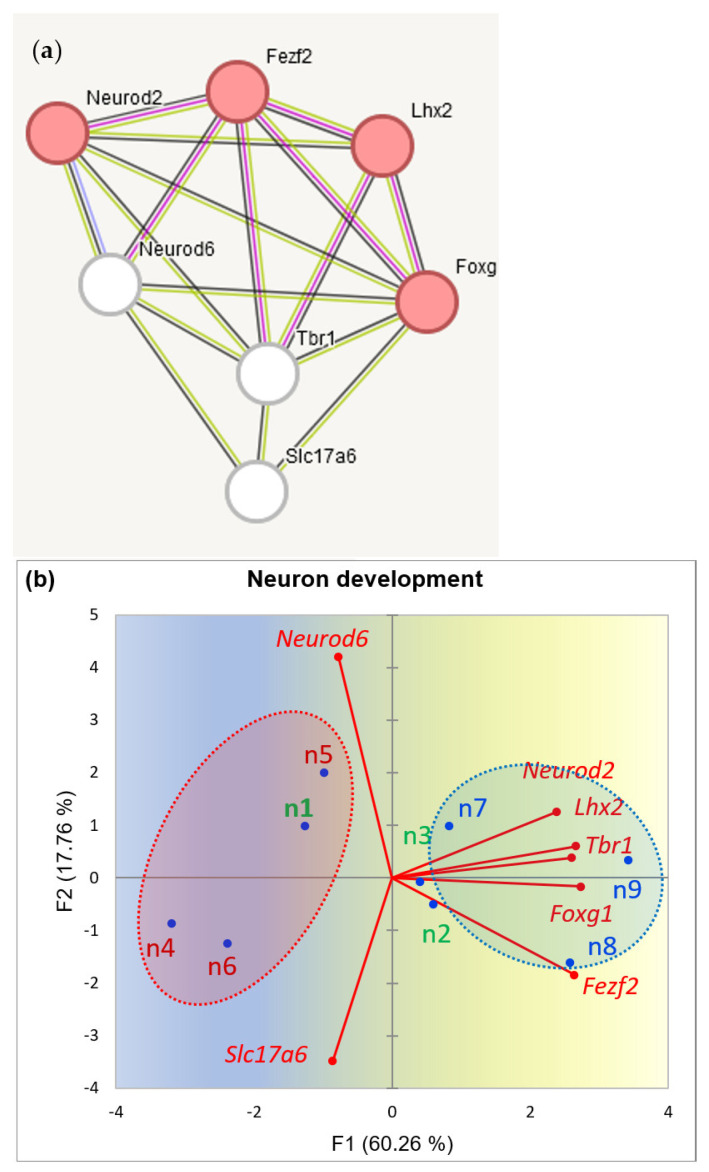
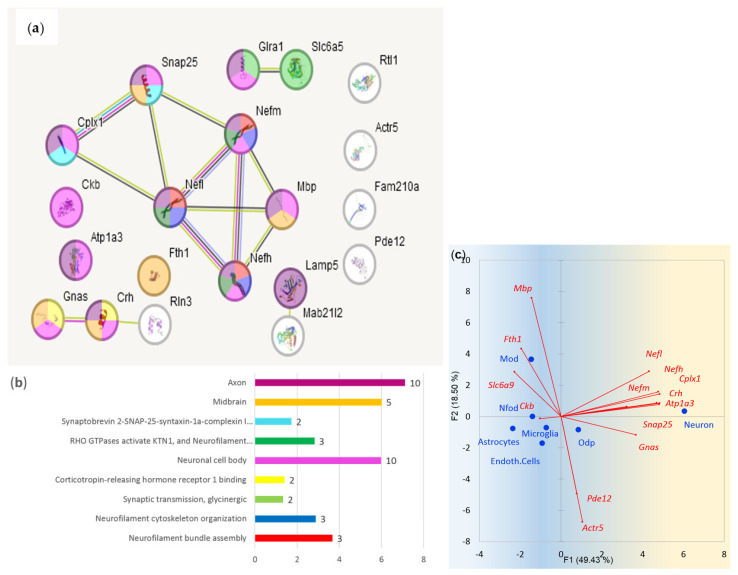
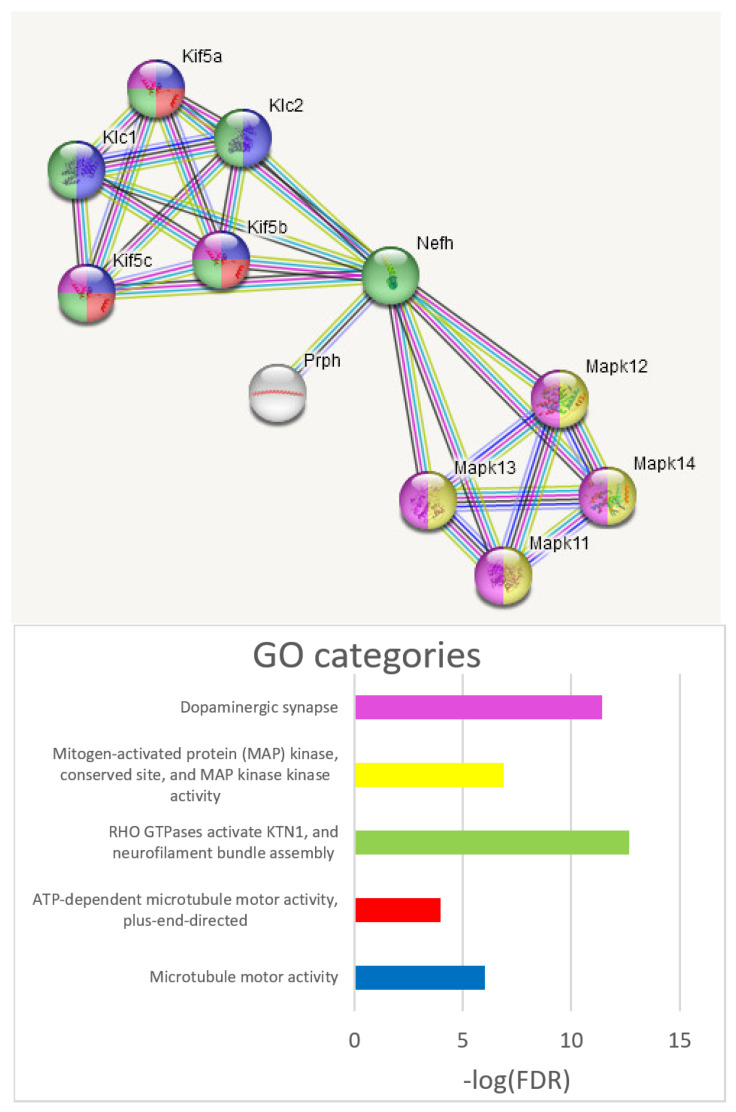
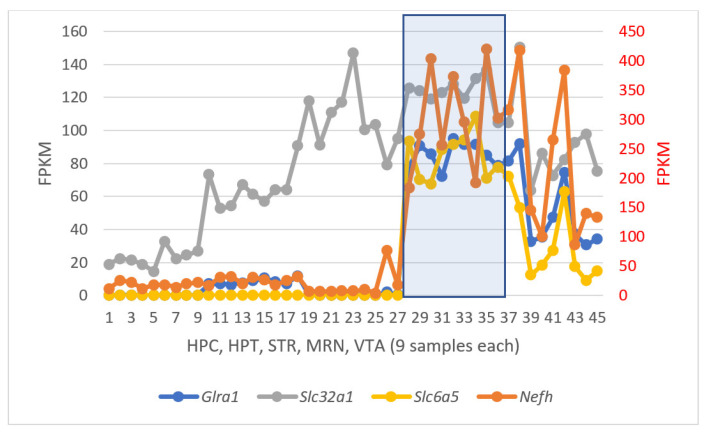
The analysis of RNA-Sec data from murine bulk tissue samples taken from five brain regions associated with behavior and stress response was conducted. The focus was on the most contrasting brain region-specific genes (BRSG) sets in terms of their expression rates. These BRSGs are identified as genes with a distinct outlying (high) expression rate in a specific region compared to others used in the study. The analysis suggested that BRSG sets form non-randomly connected compact gene networks, which correspond to the major neuron-mediated functional processes or pathways in each brain region. The number of BRSGs and the connection rate were found to depend on the heterogeneity and coordinated firing rate of neuron types in each brain region. The most connected pathways, along with the highest BRSG number, were observed in the Striatum, referred to as Medium Spiny Neurons (MSNs), which make up 95% of neurons and exhibit synchronous firing upon dopamine influx. However, the Ventral Tegmental Area/Medial Raphe Nucleus (VTA/MRN) regions, although primarily composed of monoaminergic neurons, do not fire synchronously, leading to a smaller BRSG number. The Hippocampus (HPC) region, on the other hand, displays significant neuronal heterogeneity, with glutamatergic neurons being the most numerous and synchronized. Interestingly, the two monoaminergic regions involved in the study displayed a common BRSG subnetwork architecture, emphasizing their proximity in terms of axonal throughput specifics and high-energy metabolism rates. This finding suggests the concerted evolution of monoaminergic neurons, leading to unique adaptations at the genic repertoire scale. With BRSG sets, we were able to highlight the contrasting features of the three groups: control, depressive, and aggressive mice in the animal chronic stress model. Specifically, we observed a decrease in serotonergic turnover in both the depressed and aggressive groups, while dopaminergic emission was high in both groups. There was also a notable absence of dopaminoceptive receptors on the postsynaptic membranes in the striatum in the depressed group. Additionally, we confirmed that neurogenesis BRSGs are specific to HPC, with the aggressive group showing attenuated neurogenesis rates compared to the control/depressive groups. We also confirmed that immune-competent cells like microglia and astrocytes play a crucial role in depressed phenotypes, including mitophagy-related gene Prkcd. Based on this analysis, we propose the use of BRSG sets as a suitable framework for evaluating case-control group-wise assessments of specific brain region gene pathway responses.

Keywords: animal chronic stress model; brain regions; dopamine; serotonin.


Conflict of interest statement

The authors declare no conflicts of interest.

Figures

Figure 1
Figure 1
Depiction of glutamate VgluT1 (Slc17a7) and GABA VGAT (Slc32a1) vesicle transporters FPKM values across 45 samples of 5 brain regions (X axis); 9 samples (dots) per region consequently ordered as 3 controls, 3 aggressive (‘winners’), 3 depressive (‘losers’) mice. Encircled are three loser samples in HPC and STR regions discussed further.
Figure 2
Figure 2
Distribution of BRSGs across 5 brain regions and their expression rate breakdown.
Figure 3
Figure 3
(a) 33 from 78 (singletons hidden) nodes gene network built from the BRSG list for STR (Table S1) with stringent links (high confidence score > 0.7; (string-db.org; Table 2). In total, 45 disconnected nodes (singletons) are hidden. (b) Statistics of selected categories of gene ontology. GO categories bar colors correspond to those of nodes shown in (a). The numbers of the corresponding genes are presented as bar labels. Full GO annotation presented in Table S2.
Figure 4
Figure 4
Three pairs of BRSGs from Figure 3 expanded to pathways belong to nuclear compartment-regulating transcription/deacetylation: Dtx5–Dtx6, Egr1–Egr3, Rarb-Rxrg (encircled). Color encoding is presented in Table 3.
Figure 5
Figure 5
PCA plot of 78 STR BRS gene distribution (red dots; Table S1) against 9 samples (blue dots). Control samples are green shaded; aggressive (winners) have red tags; losers bear blue tags. Gradient color shading underlines the elevation of overall gene expression rate in the right part (blue → yellow).
Figure 6
Figure 6
Prkcd expression in brain cells (Ascot database; [30]). It maintains at least five cassette exons, which feature majorly switch-on/off expression mode according to PSI score. It expresses in microglia (mitochondria) and in DRG neurons/cochlear hair cells.
Figure 7
Figure 7
(a) PCA plot of mitophagy-related genes (mmu04137 (mitophagy); GO:0033554 (Cellular response to stress); GO:0048518 (Positive regulation of biological process)); 15 genes, including Prkcd) against 9 STR samples, 3 groups: control (green shaded), aggressive (red shaded), loser (blue shaded). Encircled are canonical (red circle) and PRKN-independent (blue circle) mitophagy cycles. Marker genes are in bold. Gradient color shading underlines the elevation of overall gene expression rate in the right part (blue → yellow). (b) PCA plot of 6 control mice (green) and 6 depressive mice (blue) against 15 mitophagy-related genes in STR (see (a)). Blue dots correspond to samples. Data from [17]. Encircled are the Prkn-independent mitophagy pathway (blue shaded) and the canonical Prkn-related one (red shaded).
Figure 8
Figure 8
(a) Genes network of 17 from 46 (singletons hidden) nodes built with BRSG list for HPT (Table S1) with high confidence score (> 0.7; Table 2). The nodes’ color indicate GO categories shown in the chart below. (b) Statistics of selected categories of gene ontology (full GO ontology is provided in Table S4). The numbers of the corresponding genes are given as labels for each category. The statistic for the edges enrichment: observed edges number: 18; expected: 1 p < 1 × 10⁻¹⁶.
Figure 8
Figure 8
(a) Genes network of 17 from 46 (singletons hidden) nodes built with BRSG list for HPT (Table S1) with high confidence score (> 0.7; Table 2). The nodes’ color indicate GO categories shown in the chart below. (b) Statistics of selected categories of gene ontology (full GO ontology is provided in Table S4). The numbers of the corresponding genes are given as labels for each category. The statistic for the edges enrichment: observed edges number: 18; expected: 1 p < 1 × 10⁻¹⁶.
Figure 9
Figure 9
Three non-annotated BRSG pairs in Figure 8a expanded networks (by string-db.org). (a) Gabre-Hap1- pair extension; (b) Asb4-Irs4 pair extension; (c) Nnat-Peg10 pair extension. Seeding BRSGs are marked with orange arrows. GO color encoding for each genes network is in Table 4.
Figure 10
Figure 10
Distribution of 46 BRSGs (red dots) in the projection of 9 observations (blue dots) in the HPT region (n10, n11, n12–control (green shaded); n13, n14, n15–aggressive (red tags); n16, 17, n18–losers (blue tags)). Hormone-associated genes are bold typed. Gradient color shading underlines the elevation of the gene expression rate in the right part. Random clustering of affected subjects (5 samples) on the right side, rejected with p-value < 0.012 (binomial test).
Figure 11
Figure 11
(a) Gene network of the 56 genes of the HPC BRSGs list using string-db.org. The colors indicate GO categories shown in the line chart below. (b) Statistics of selected categories of gene ontology. The number of the corresponding genes are given as bar labels for each GO category. The number of edges (59) exceeds the expected value (6) with probability p < 1 × 10⁻¹⁶ (string-db.org report). Full GO annotation is located in Table S5.
Figure 12
Figure 12
Distribution of 56 HPC BRSGs (red dots) in the projection of 9 observations (blue dots) in HPC region (c1, c2, c3–control (green tags); w4, w5, w6 –aggressive (red tags); l7, l8, l9–losers (blue tags)). Encircled are winner (red) and loser (blue) mice groups. Gradient color shading underlines the elevation of the gene expression rate in the right part. Random clustering of winners on the left side/losers on the right side, rejected with p-value < 0.125 (binomial test).
Figure 13
Figure 13
(a) HPC Neuron development pathway of BRSGs (red shaded circles; GO: 0048666) and associated ‘multi-purpose’ genes (white circles). (b) PCA plot of 9 samples (red-typed—winners, blue—losers; green—control). Random clustering of winners on the left side (red shaded) versus losers (blue shaded) on the right side, rejected with p-value < 0.02 (binomial test).
Figure 14
Figure 14
(a) 29 MRN/VTA BRS genes’ functional architecture (Table 5). Observed number of edges: 23; expected number of edges: 2. Observed/expected edges ratio yields p-value = 1 × 10⁻¹⁶ (taken from string-db.org report). (b) Sampled GO annotation of 29 MRN/VTA BRS genes. The color scheme corresponds to (a). Number of genes per category is attached as bar labels. Full GO annotation is located in Table S6. (c) Cell line specific BRSGs distribution based on data in [3] for 7 basic brain cell types. ‘Mod’ abbreviates ‘Myelination oligodendrocytes’; ‘Nfod’ stands for ‘Newly formed olygodendrocytes’, ‘Odp’ denotes ‘Olygodendrocyte precursors’. BRS genes with small expression rates (FPKM < 1) in [3], Rtl1, Mab21l2, Slc6a5, Glra1, and Rln3 (Figure 14a), were dismissed on the plot (c).
Figure 15
Figure 15
Nefh axon-associated complex mediated with “kinesin motor” anterograde system (created by string-db.org by Nefh seed). Nefh also mediates dopaminergic synapse MAP-kinase network.
Figure 16
Figure 16
Elevated rate of anterograde axon transport and glycinergic activity across the brain regions based on four BRS genes. MRN region is blue shaded and maintained the highest average gene expression rates (Table 5), while VTA rates (last nine samples) are lower on average.
Figure 17
Figure 17
PCA plot of myelin sheath genes activity (GO:0043209; 5 genes associated with Mbp) recovered by the Mbp seed in string-db.org profiled against 45 samples of 5 brain regions expressed the most in VTA/MRN areas. Green shaded labels are HPC samples, orange shaded ones are HPT, blue colored are STR, red colored are VTA, and purple shaded are MRN. Gradient color shading underlines the elevation of gene expression rate in the right part. Nonrandom clustering of 18 VTA/MRN samples in the right part of the plot is rejected with p-value = 3.8 × 10⁻⁶.
Figure 18
Figure 18
PCA plot of small and large (Rps*/Rpl*) nuclear ribosomal subunits (64 genes; red dots) according to their expression gradients against 45 brain region samples. Blue dots correspond to brain region samples. Gradient coloring underlines gene expression activity direction (blue → yellow). Random clustering of HPT (red labeled) and STR (green labeled) samples on the right side rejected with p-value < 7.25 × 10⁻⁵ (binomial test).
Figure 19
Figure 19
(a) Increased activity of mitochondrial ribosome subunit genes (Mrpl*/Mrps*) in the VTA and MRN regions (right half of the graph); (b) TCA cycle (Aco2, Mdh1, Mdh2, Sdha, Idh3b) gene expression rates across five brain regions. Red dots correspond to ribosomal subunit genes projection, blue dots signify the corresponding samples of brain regions. Gradient coloring underlines gene expression activity direction (blue → yellow). The MRN area encircled by a blue shaded oval underscores greater metabolic intensity than VTA. Random clustering of VTA and MRN samples in the right part rejected with p-values: (a) 6.9 × 10⁻⁵; (b) 3.8 × 10⁻⁶ (binomial test).
Figure 20
Figure 20
PCA projection of 18 samples (MRN, VTA) against the common pool of BRS genes (Table 5). Green shaded are controls, red labeled are aggressive mice, blue labeled are losers. Blue dots are samples, red dots are BRSGs. Gradient coloring represents BRSG activity trend. *—labeled VTA sample maintains the highest depressive phenotype among looser group.

Similar articles

Cited by

References

    1. Wang Z., Gerstein M., Snyder M. RNA-Seq: A revolutionary tool for transcriptomics. Nat. Rev. Genet. 2009;10:57–63. doi: 10.1038/nrg2484. - DOI - PMC - PubMed
    1. Bennett M.L., Bennett F.C., Liddelow S.A., Ajami B., Zamanian J.L., Fernhoff N.B., Mulinyawe S.B., Bohlen C.J., Adil A., Tucker A., et al. New tools for studying microglia in the mouse and human CNS. Proc. Natl. Acad. Sci. USA. 2016;113:E1738–E1746. doi: 10.1073/pnas.1525528113. - DOI - PMC - PubMed
    1. Zhang Y., Chen K., Sloan S.A., Bennett M.L., Scholze A.R., O’Keeffe S., Phatnani H.P., Guarnieri P., Caneda C., Ruderisch N., et al. An RNA-sequencing transcriptome and splicing database of glia, neurons, and vascular cells of the cerebral cortex. J. Neurosci. 2014;34:11929–11947. doi: 10.1523/JNEUROSCI.1860-14.2014. - DOI - PMC - PubMed
    1. Darmanis S., Sloan S.A., Zhang Y., Enge M., Caneda C., Shuer L.M., Gephart M.G.H., Barres B.A., Quake S.R. A survey of human brain transcriptome diversity at the single cell level. Proc. Natl. Acad. Sci. USA. 2015;112:7285–7290. doi: 10.1073/pnas.1507125112. - DOI - PMC - PubMed
    1. Zeisel A., Muñoz-Manchado A.B., Codeluppi S., Lönnerberg P., La Manno G., Juréus A., Marques S., Munguba H., He L., Betsholtz C., et al. Brain structure. Cell types in the mouse cortex and hippocampus revealed by single-cell RNA-seq. Science. 2015;347:1138–1142. doi: 10.1126/science.aaa1934. - DOI - PubMed

LinkOut - more resources