. 2024 Mar 3;25(5):2941.
doi: 10.3390/ijms25052941.

Phosphorylated CPI-17 and MLC2 as Biomarkers of Coronary Artery Spasm-Induced Sudden Cardiac Death

Affiliations

Phosphorylated CPI-17 and MLC2 as Biomarkers of Coronary Artery Spasm-Induced Sudden Cardiac Death

Yiming Dong et al. Int J Mol Sci. .

Abstract

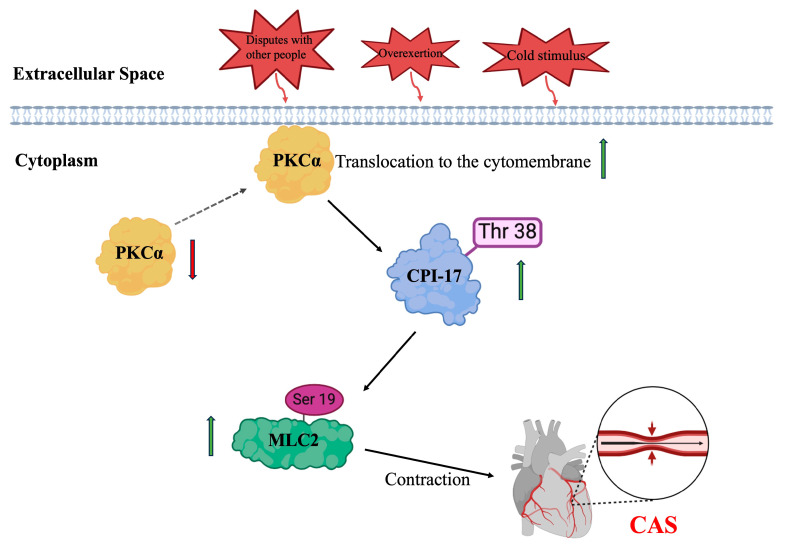
Coronary artery spasm (CAS) plays an important role in the pathogeneses of various ischemic heart diseases and has gradually become a common cause of life-threatening arrhythmia. The specific molecular mechanism of CAS has not been fully elucidated, nor are there any specific diagnostic markers for the condition. Therefore, this study aimed to examine the specific molecular mechanism underlying CAS, and screen for potential diagnostic markers. To this end, we successfully constructed a rat CAS model and achieved in vitro culture of a human coronary-artery smooth-muscle cell (hCASMC) contraction model. Possible molecular mechanisms by which protein kinase C (PKC) regulated CAS through the C kinase-potentiated protein phosphatase 1 inhibitor of 17 kDa (CPI-17)/myosin II regulatory light chain (MLC2) pathway were studied in vivo and in vitro to screen for potential molecular markers of CAS. We performed hematoxylin and eosin staining, myocardial zymogram, and transmission electron microscopy to determine myocardial and coronary artery injury in CAS rats. Then, using immunohistochemical staining, immunofluorescence staining, and Western blotting, we further demonstrated a potential molecular mechanism by which PKC regulated CAS via the CPI-17/MLC2 pathway. The results showed that membrane translocation of PKCα occurred in the coronary arteries of CAS rats. CPI-17/MLC2 signaling was observably activated in coronary arteries undergoing CAS. In addition, in vitro treatment of hCASMCs with angiotensin II (Ang II) increased PKCα membrane translocation while consistently activating CPI-17/MLC2 signaling. Conversely, GF-109203X and calphostin C, specific inhibitors of PKC, inactivated CPI-17/MLC2 signaling. We also collected the coronary artery tissues from deceased subjects suspected to have died of CAS and measured their levels of phosphorylated CPI-17 (p-CPI-17) and MLC2 (p-MLC2). Immunohistochemical staining was positive for p-CPI-17 and p-MLC2 in the tissues of these subjects. These findings suggest that PKCα induced CAS through the CPI-17/MLC2 pathway; therefore, p-CPI-17 and p-MLC2 could be used as potential markers for CAS. Our data provide novel evidence that therapeutic strategies against PKC or CPI-17/MLC2 signaling might be promising in the treatment of CAS.

Keywords: CPI-17/MLC2 signaling; PKC; biomarker; coronary artery spasm.


Conflict of interest statement

The authors declare that the research was conducted in the absence of any commercial or financial relationships that could be construed as potential conflicts of interest.

Figures

Figure 1
Figure 1
CAS caused myocardial injury and morphological changes to coronary artery tissues. (A) Representative ECG records of rats. (BE) Serum levels of CK, CK-MB, LDH, and LDH1 at different time points after Pit injection in rats. n = 6 per group. (F) Representative H&E-stained images of rat myocardial tissues. Red arrow: swelling of myocardial fibers. Scale bar from left to right: 100 µm; 50 µm. (G) Representative H&E-stained images of rat LADAs. Red arrows: SMC vacuolation and increased endothelial and tunica intima folding. n = 6 per group. Scale bar from left to right: 100 µm; 50 µm. (H) Representative TEM images of rat myocardial tissues. Scale bar from left to right: 5 µm; 1 µm. Data are presented as mean ± standard error of the mean (SEM); ns, no significance; ** p < 0.01 and *** p < 0.001 vs. control group. Pit: pituitrin; CK: creatine kinase; CK-MB: creatine kinase isoenzyme MB; LDH: lactate dehydrogenase; LDH1: lactate dehydrogenase isoenzyme 1; CAS: coronary artery spasm; TEM: transmission electron microscopy.
Figure 2
Figure 2
Treatment of hCASMCs with Ang II increased phosphorylation levels of MLC2 and promoted hCASMC contractile activities. We treated hCASMCs with different doses of Ang II. IF was used to measure the expression level of p-MLC2 (A,B) to observe cytoplasmic myoneme myofilament formation in hCASMCs. We exposed hCASMCs to constant doses of Ang II (0.1 μM/mL), which were administered based on increase in hCASMCs with time. IF was used to measure p-MLC2 expression level (C,D). n = 5 per group. Scale bar: 75 µm. Data presented as mean ± SEM. *** p < 0.001 vs. control group. hCASMCs: human coronary artery smooth-muscle cells; Ang II: angiotensin II; MLC2: myosin II regulatory light chain; p-MLC2: phosphorylated myosin II regulatory light chain.
Figure 3
Figure 3
Effects of CAS on the expression of phosphorylated CPI-17 in rat coronary arteries. (A,B) Representative photomicrographs and semi-quantitative data of p-CPI-17 protein levels detected via IHC staining. Lower enlarged images are from upper images. n = 6 per group. Scale bar: 100 µm (upper images) or 50 µm (lower images). (C) Representative immunofluorescent images of p-CPI-17 (red) and DAPI (blue) in the coronary arteries of rats. Scale bar: 50 µm. (D) The mean fluorescence intensity of p-CPI-17 per section was quantified. n = 6 per group. (E,F) Western blot and quantitative analysis of p-CPI-17 protein levels of rat coronary arteries. n = 6 per group. Data presented as mean ± SEM. ** p < 0.01 vs. control group. CPI-17: C kinase-potentiated protein phosphatase 1 inhibitor of 17 kDa; p-CPI-17: phosphorylated C kinase-potentiated protein phosphatase 1 inhibitor of 17 kDa.
Figure 4
Figure 4
Effects of CAS on the expression of phosphorylated MLC2 in rat coronary arteries. (A,B) Representative photomicrographs and semi-quantitative data of p-MLC2 protein levels detected via IHC staining. Lower enlarged images are from upper images. n = 6 per group. Scale bar: 100 µm (upper images) or 50 µm (lower images). (C) Representative immunofluores-cent images of p-MLC2 (red) and DAPI (blue) in the coronary arteries of rats. Scale bar: 50 µm. (D) The mean fluorescence intensity of p-MLC2 per section was quantified. n = 6 per group. (E,F) Western blot and quantitative analysis of p-MLC2 protein levels of rat coronary arteries. n = 6 per group. Data presented as mean ± SEM. ** p < 0.01 and *** p < 0.001 vs. control group.
Figure 5
Figure 5
PKC was activated during contraction of CAS coronary arteries in vivo (n = 5 per group). Pit-induced PKC translocation in coronary arteries. (A) Representative WB shows PKCα in cytosolic and membrane particulate fractions. Results are expressed as the grayscale ratio of cytoplasmic PKCα to cell membrane PKCα. (B) Representative WB shows PKCδ in cytosolic and membrane particulate fractions. Results are expressed as the grayscale ratio of cytoplasmic PKCδ to cell membrane PKCδ. (C) Representative WB shows PKCε in cytosolic and membrane particulate fractions. Results are expressed as the grayscale ratio of cytoplasmic PKCε to cell membrane PKCε. Data presented as mean ± SEM. ns, no significance; *** p < 0.001 vs. control group. PKC: protein kinase C.
Figure 6
Figure 6
PKC was activated during contraction of hCASMCs in vitro (n = 5 per group). Ang II induced redistribution of PKC in hCASMCs. (A) The curve represents changes in PKCα fluorescence intensity along the “a” to “b” axis. The plot profile of the intensity from “a” to “b” was performed using ImageJ software (version 1.8.0; U.S. National Institutes of Health, Bethesda, MD, USA, https://imagej.net/ij/index.html, accessed on 18 June 2023). (B,C) Representative IF images of PKCδ (green) and DAPI (blue) in hCASMCs. Scale bar: 75 µm. The curve represents changes in intensity along the “a” to “b” axis. The plot profile of the intensity from “a” to “b” was performed using ImageJ software. (D,E) Representative IF images of PKCε (green) and DAPI (blue) in hCASMCs. Scale bar: 75 µm. The curve represents changes in intensity along the “a” to “b” axis. The plot profile of the intensity from “a” to “b” was performed using ImageJ software. Data presented as mean ± SEM.
Figure 7
Figure 7
PKC mediates CPI-17/MLC2 signaling-induced contraction in cultured hCASMCs. (A) Representative immunofluorescent images of PKCα (green) and DAPI (blue) in hCASMCs. Scale bar: 75 µm. (B) The 3D waterfall plot results of PKCα immunofluorescence staining. The abscissa is the length of the cell section, and the ordinate is the gray value from a to b. (C) Representative immunofluorescent images of p-CPI-17 (red) and DAPI (blue) in cultured hCASMCs. Scale bar: 75 µm. (D) The mean fluorescence intensity of p-CPI-17 per section was quantified. n = 5 per group. (E) Representative immunofluorescent images of p-MLC2 (red) and DAPI (blue) in cultured hCASMCs. Scale bar: 75 µm. (F) The mean fluorescence intensity of p-MLC2 per section was quantified. n = 5 per group. Data presented as mean ± SEM. ns, no significance. *** p < 0.001 vs. control group; ### p < 0.001 vs. Ang II group.
Figure 8
Figure 8
CPI-17 and MLC2 were moderately to highly phosphorylated in coronary arteries in deceased patients suspected to have suffered CAS-induced SCD (n = 3 per group). (A,B) Representative photomicrographs and semi-quantitative data of p–CPI-17 protein levels as detected by IHC staining. Bottom images are enlargements of top images. Arrows: positive staining for p–CPI-17 in vascular SMCs. Scale bar: 1 mm (top) or 100 µm (bottom). (C,D) Representative photomicrographs and semi-quantitative data of p-MLC2 protein levels detected via IHC staining. Bottom images are enlargements of top images. Arrows: positive staining for p-MLC2 in vascular SMCs. Scale bar: 2 mm (top) or 200 µm (bottom). Data presented as mean ± SEM. ** p < 0.01 and *** p < 0.001 vs. control group.
Figure 9
Figure 9
Schematic illustration of PKC activation of the CPI-17/MLC2 pathway to induce CAS. Upon predisposing factors (e.g., disputes with other people, overexertion, cold stimulus), PKCα is activated; it translocates from cytoplasm to the cell membrane to exert its effects. PKC promotes the phosphorylation of CPI-17 at threonine 38, which in turn promotes the phosphorylation of MLC2 at serine 19, thereby facilitating coronary artery contraction and eventually contributing to CAS. Thr 38: threonine 38; Ser 19: serine 19. Red arrow represents the decrease of protein expression level; Green arrows represent the increase of protein expression levels.

Similar articles

References

    1. Matta A., Bouisset F., Lhermusier T., Campelo-Parada F., Elbaz M., Carrié D., Roncalli J. Coronary Artery Spasm: New Insights. J. Interv. Cardiol. 2020;2020:5894586. doi: 10.1155/2020/5894586. - DOI - PMC - PubMed
    1. Yasue H., Mizuno Y., Harada E. Coronary artery spasm—Clinical features, pathogenesis and treatment. Proc. Jpn. Acad. Ser. B Phys. Biol. Sci. 2019;95:53–66. doi: 10.2183/pjab.95.005. - DOI - PMC - PubMed
    1. Yasue H. Coronary artery spasm: Not rare but not fully understood yet. Int. J. Cardiol. 2022;364:18–19. doi: 10.1016/j.ijcard.2022.05.050. - DOI - PubMed
    1. Myerburg R.J., Junttila M.J. Sudden cardiac death caused by coronary heart disease. Circulation. 2012;125:1043–1052. doi: 10.1161/CIRCULATIONAHA.111.023846. - DOI - PubMed
    1. Teragawa H., Oshita C., Ueda T. Coronary spasm: It’s common, but it’s still unsolved. World J. Cardiol. 2018;10:201–209. doi: 10.4330/wjc.v10.i11.201. - DOI - PMC - PubMed

LinkOut - more resources