. 2024 Mar 4;25(5):2975.
doi: 10.3390/ijms25052975.

DIA-Based Proteomic Analysis Reveals MYOZ2 as a Key Protein Affecting Muscle Growth and Development in Hybrid Sheep

Affiliations

DIA-Based Proteomic Analysis Reveals MYOZ2 as a Key Protein Affecting Muscle Growth and Development in Hybrid Sheep

Dan Zhang et al. Int J Mol Sci. .

Abstract

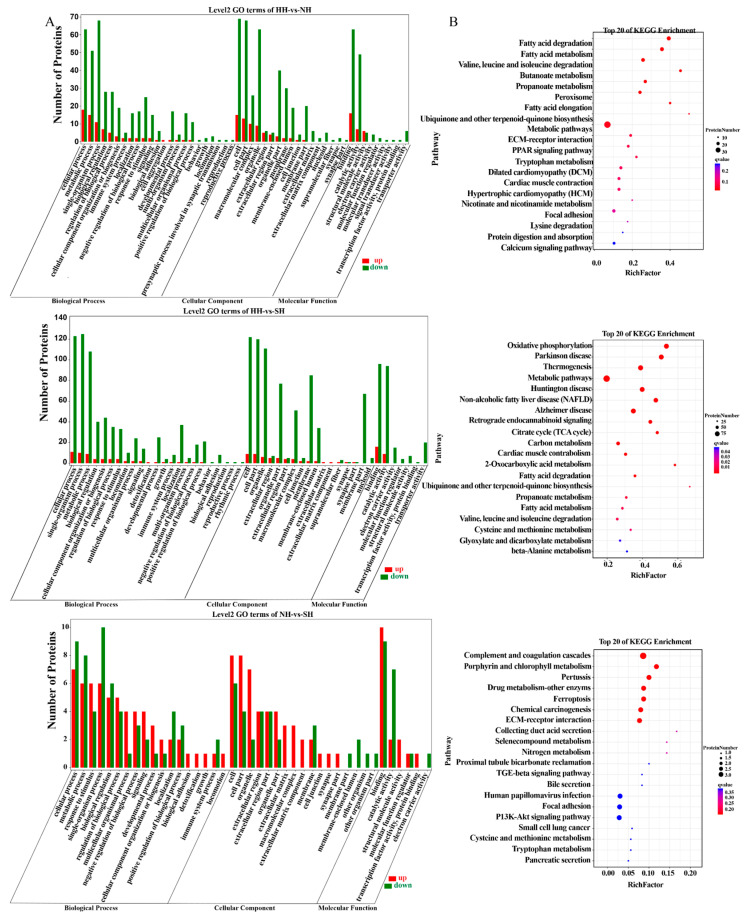
Hybridization of livestock can be used to improve varieties, and different hybrid combinations produce unique breeding effects. In this study, male Southdown and Suffolk sheep were selected to hybridize with female Hu sheep to explore the effects of male parentage on muscle growth and the development of offspring. Using data-independent acquisition technology, we identified 119, 187, and 26 differentially abundant proteins (DAPs) between Hu × Hu (HH) versus Southdown × Hu (NH), HH versus Suffolk × Hu (SH), and NH versus SH crosses. Two DAPs, MYOZ2 and MYOM3, were common to the three hybrid groups and were mainly enriched in muscle growth and development-related pathways. At the myoblast proliferation stage, MYOZ2 expression decreased cell viability and inhibited proliferation. At the myoblast differentiation stage, MYOZ2 expression promoted myoblast fusion and enhanced the level of cell fusion. These findings provide new insights into the key proteins and metabolic pathways involved in the effect of male parentage on muscle growth and the development of hybrid offspring in sheep.

Keywords: MYOZ2; growth and development; hybrid sheep; muscle; proteomic.


Conflict of interest statement

The authors declare no conflicts of interest.

Figures

Figure 1
Figure 1
Sample relationship analysis. (A) Correlation heat map is of the three groups of samples correlation heat map. (B) The Venn diagram of proteins among three groups of samples.
Figure 2
Figure 2
Identification and analysis of DAPs in the three groups of hybrid sheep. (A) The difference comparison volcano plot. (B) The overall statistical chart of differences. (C) The Venn diagram. (D) The expression level histogram of MYOZ2 and MYOM3 muscles. This figure shows the expression levels of MYOZ2 and MYOM3 in muscle tissue samples used for DIA analysis.
Figure 3
Figure 3
Functional enrichment analysis of DAPs. (A) Bar chart of the GO enrichment classification of DAPs. (B) KEGG enrichment bubble diagram of DAPs.
Figure 4
Figure 4
GSEA analysis of DAPs. (A) Enrichment lot of osteoclast differentiation signaling pathway, the positive ES (enrichment score, red curve) indicates that the gene set is enriched at the top of the list. (B) Enrichment lot of fatty acid metabolism signaling pathway, the negative ES (green curve) indicates that the gene set is enriched at the bottom of the list.
Figure 5
Figure 5
Protein interaction network of muscle growth and development. The yellow marks highlight the presence of MYOZ2 and MYOM3 in all three groups of protein interaction networks. The green marker highlights the DAPs associated with muscle growth and development in all three groups of protein interaction networks.
Figure 6
Figure 6
Effect of MYOZ2 on the proliferation of myoblasts. (A) Determination of MYOZ2 overexpression efficiency. (B) Determination of marker gene expression efficiency in myoblasts under MYOZ2 overexpression. (C) Determination of MYOZ2 interference efficiency. (D) Determination of marker gene expression efficiency in myoblasts under MYOZ2 interference. (E) CCK8 results of myoblasts. (FI) EdU assay of MYOZ2 interference (F,H) and MYOZ2 overexpression (G,I) in myoblasts. * indicates significant differences between comparison groups, ** indicates extremely significant differences between comparison groups.
Figure 7
Figure 7
Effect of MYOZ2 on the differentiation of myoblasts. (A) Determination of MYOZ2 overexpression efficiency in myoblasts. (B) Determination of marker gene expression efficiency under MYOZ2 overexpression in myoblast. (C) Determination of MYOZ2 interference efficiency in myoblast. (D) Determination of marker gene expression efficiency under MYOZ2 interference in myoblast. (E,F) IF of MYH3 in myotubes under overexpression of MYOZ2 (E) or interference with MYOZ2 (F). (G,H) Statistical analysis of the number of fused cells in myotubes of differentiating myoblast cultures under overexpression of MYOZ2 (G) or interference with MYOZ2 (H). ** indicates extremely significant differences between comparison groups.

References

    1. Birchler J.A., Yao H., Chudalayandi S., Vaiman D., Veitia R.A. Heterosis. Plant Cell. 2010;22:2105–2112. doi: 10.1105/tpc.110.076133. - DOI - PMC - PubMed
    1. Niayale R., Cui Y., Adzitey F. Male hybrid sterility in the cattle-yak and other bovines: A review. Biol. Reprod. 2021;104:495–507. doi: 10.1093/biolre/ioaa207. - DOI - PubMed
    1. Wang Y., Gao S., Zhao Y., Chen W.-H., Shao J.-J., Wang N.-N., Li M., Zhou G.-X., Wang L., Shen W.-J., et al. Allele-specific expression and alternative splicing in horse × donkey and cattle × yak hybrids. Zool. Res. 2019;40:293–304. doi: 10.24272/j.issn.2095-8137.2019.042. - DOI - PMC - PubMed
    1. Chen Z.J. Genomic and epigenetic insights into the molecular bases of heterosis. Nat. Rev. Genet. 2013;14:471–482. doi: 10.1038/nrg3503. - DOI - PubMed
    1. Miao X., Luo Q., Qin X., Guo Y., Zhao H. Genome-wide mRNA-seq profiling reveals predominant down-regulation of lipid metabolic processes in adipose tissues of Small Tail Han than Dorset sheep. Biochem. Biophys. Res. Commun. 2015;467:413–420. doi: 10.1016/j.bbrc.2015.09.129. - DOI - PubMed

LinkOut - more resources