. 2024 Mar 5;25(5):3003.
doi: 10.3390/ijms25053003.

Exploring Individual Variability in Drug-Induced Liver Injury (DILI) Responses through Metabolomic Analysis

Affiliations

Exploring Individual Variability in Drug-Induced Liver Injury (DILI) Responses through Metabolomic Analysis

Marta Moreno-Torres et al. Int J Mol Sci. .

Abstract

Drug-induced liver injury (DILI) is a serious adverse hepatic event presenting diagnostic and prognostic challenges. The clinical categorization of DILI into hepatocellular, cholestatic, or mixed phenotype is based on serum alanine aminotransferase (ALT) and alkaline phosphatase (ALP) values; however, this classification may not capture the full spectrum of DILI subtypes. With this aim, we explored the utility of assessing changes in the plasma metabolomic profiles of 79 DILI patients assessed by the RUCAM (Roussel Uclaf Causality Assessment Method) score to better characterize this condition and compare results obtained with the standard clinical characterization. Through the identification of various metabolites in the plasma (including free and conjugated bile acids and glycerophospholipids), and the integration of this information into predictive models, we were able to evaluate the extent of the hepatocellular or cholestatic phenotype and to assign a numeric value with the contribution of each specific DILI sub-phenotype into the patient's general condition. Additionally, our results showed that metabolomic analysis enabled the monitoring of DILI variability responses to the same drug, the transitions between sub-phenotypes during disease progression, and identified a spectrum of residual DILI metabolic features, which can be overlooked using standard clinical diagnosis during patient follow-up.

Keywords: DILI; biomarkers; cholestasis; hepatocellular damage; hepatotoxicity; idiosyncratic DILI; metabolomics; updated RUCAM.


Conflict of interest statement

The authors declare no conflicts of interest.

Figures

Figure 1
Figure 1
Schematic workflow of data analysis and modeling strategy. Ternary plot employed to characterize the distinct DILI phenotypes, including cholestatic, hepatocellular, mixed, and those observed in recovered patients. PLS-DA models were performed to compare hepatocellular DILI versus a group consisting of cholestatic DILI and recovered patients, cholestatic DILI versus a group comprising hepatocellular DILI and recovered patients and recovered patients versus a group encompassing hepatocellular and cholestatic DILI patients. The PLS predicted values using the three models from metabolomics data were graphically represented using ternary plots. The position of the sample in the ternary diagram should be interpreted as follows, considering 0 and 1 in the axis scale as 0% and 100% of each corresponding phenotype. In the mixed phenotype sample (white) selected as example, the arrows indicate the contribution of each DILI phenotype to the patient’s current status, a 30% of cholestatic DILI phenotype (C), 40% of recovered phenotype (R), and 30% of hepatocellular DILI phenotype (H). Each color indicates the phenotype of the samples according to the R score-based clinical classification: green: cholestatic; orange: hepatocellular; white: mixed; blue: recovered patient. Figure adapted from Quintás et al. [16].
Figure 2
Figure 2
Ternary plots obtained from the analysis of samples collected from DILI patients. Each plot represents patients for whom a specific drug was identified as the causative agent responsible for the DILI event. Dot color represents the R score-based clinical classification; green: cholestatic; orange: hepatocellular; white: mixed; blue: recovered patient.
Figure 3
Figure 3
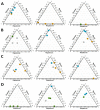
Ternary plots obtained from the analysis of samples collected from DILI patients. Each plot represents results from the analysis of samples collected from a single patient. The number inside each circle indicates the order of collected samples and is meant to identify the patients’ metabolome over time after the onset of the DILI event. Dot color represents the R score-based clinical classification; green: cholestatic; orange: hepatocellular; white: mixed; blue: recovered patient. (A) Patients 62, 24, and 59 (from left to right) classified as hepatocellular (R score > 5) with a cholestatic (62) and mixed (24 and 59) metabolomic profile; (B) patients 30, 102, and 34 (from left to right) classified as mixed (2 < R score < 5) with a cholestatic metabolic profile; (C) patients 17, 114, and 137 (from left to right) classified as mixed (2 < R score < 5) with a hepatocellular metabolic profile; (D) patients 48, 136, and 80 (from left to right) classified as cholestatic (R score < 2) with a metabolomic mixed phenotype (see also Table S1).
Figure 4
Figure 4
Ternary plots obtained from the analysis of samples collected from DILI patients clinically classified as recovered. Each plot represents results from the analysis of samples collected from a single patient. All patients represented were classified as recovered based on biochemical parameters at the times indicated by the red arrows. (A) Patients 14, 51, 89, and 108 (from left to right), and (B) patients 49, 78, 80, and 108 (from left to right). Dot color represents the clinical classification at each point: green: cholestatic DILI; orange: hepatocellular DILI; white: mixed DILI; blue: recovered patient. The number inside each circle indicates the order of collected samples and is meant to identify the patients’ metabolome over time after the onset of the DILI event. Each ternary plot represents the results of a specific individual and the number within each dot indicates the timing of the samples.
Figure 5
Figure 5
Ternary plots obtained from the analysis of samples collected from DILI patients during monitoring. Each plot represents results from the analysis of samples collected from a single patient and the number within each dot indicates the timing of the samples. Dot color represents the clinical classification at each point: green, cholestatic DILI; orange: hepatocellular DILI; white: mixed DILI; blue: recovered patient. Ternary plots of (AC) patients 87, 94, and 36 (from left to right) and (DF) patient samples 17, 24, and 136 (from left to right) with a DILI progression within the same sub-phenotype towards recovery or not.
Figure 6
Figure 6
Experimental workflow of metabolomics analysis in DILI samples. Plasma samples were collected from DILI patients. Following metabolite extraction, metabolomics analysis was performed on UPLC-MS platform. Data obtained were subsequently preprocessed (peak table generation, batch effect correction, blank filtering, etc.) before PLS-DA models were generated. PLS-DA predicted values were integrated into a ternary plot to facilitate a visual and straightforward interpretation of a classification outcome (see Figure 1).

Similar articles

References

    1. Navarro V.J., Senior J.R. Drug-related hepatotoxicity. N. Engl. J. Med. 2006;354:731–739. doi: 10.1056/NEJMra052270. - DOI - PubMed
    1. Andrade R.J., Lucena M.I., Kaplowitz N., García-Muņoz B., Borraz Y., Pachkoria K., García-Cortés M., Fernández M.C., Pelaez G., Rodrigo L., et al. Outcome of acute idiosyncratic drug-induced liver injury: Long-term follow-up in a hepatotoxicity registry. Hepatology. 2006;44:1581–1588. doi: 10.1002/hep.21424. - DOI - PubMed
    1. Andrade R.J., Lucena M.I., Fernández M.C., Pelaez G., Pachkoria K., García-Ruiz E., García-Muñoz B., González-Grande R., Pizarro A., Durán J.A., et al. Drug-induced liver injury: An analysis of 461 incidences submitted to the Spanish registry over a 10-year period. Gastroenterology. 2005;129:512–521. doi: 10.1016/j.gastro.2005.05.006. - DOI - PubMed
    1. Björnsson E., Davidsdottir L. The long-term follow-up after idiosyncratic drug-induced liver injury with jaundice. J. Hepatol. 2009;50:511–517. doi: 10.1016/j.jhep.2008.10.021. - DOI - PubMed
    1. Björnsson E.S., Björnsson H.K. Mortality associated with drug-induced liver injury (DILI) Transl. Gastroenterol. Hepatol. 2017;2:114. doi: 10.21037/tgh.2017.11.16. - DOI - PMC - PubMed

Substances