. 2024 Mar 6;25(5):3063.
doi: 10.3390/ijms25053063.

Evaluating Temperature Effects on Bluetongue Virus Serotype 10 and 17 Coinfection in Culicoides sonorensis

Affiliations

Evaluating Temperature Effects on Bluetongue Virus Serotype 10 and 17 Coinfection in Culicoides sonorensis

Molly Carpenter et al. Int J Mol Sci. .

Abstract

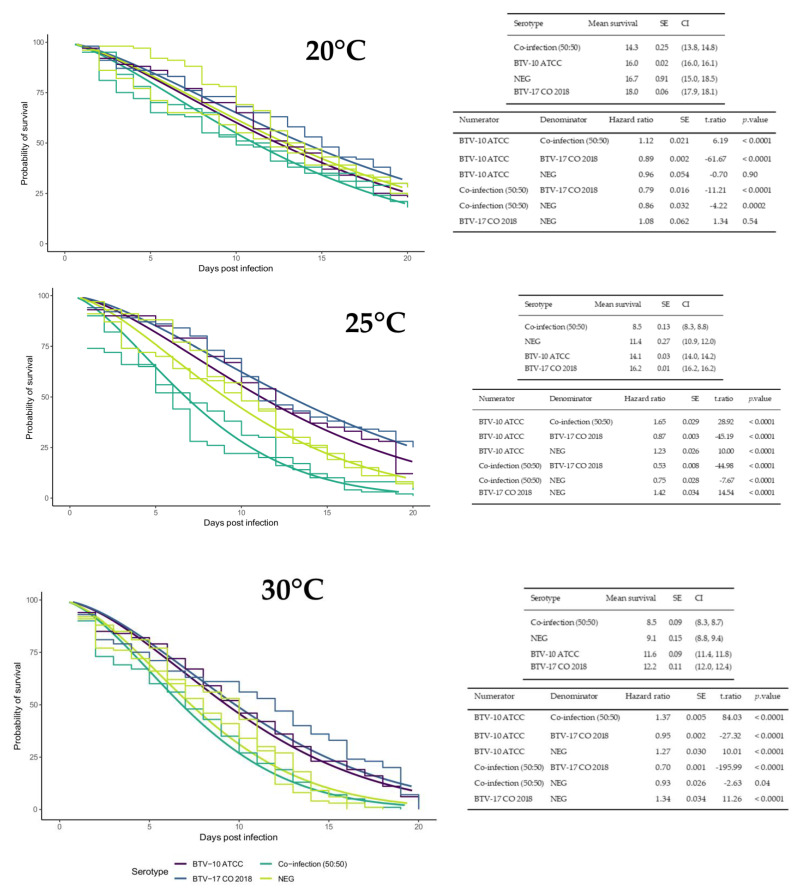
Bluetongue virus (BTV) is a segmented, double-stranded RNA virus transmitted by Culicoides midges that infects ruminants. As global temperatures increase and geographical ranges of midges expand, there is increased potential for BTV outbreaks from incursions of novel serotypes into endemic regions. However, an understanding of the effect of temperature on reassortment is lacking. The objectives of this study were to compare how temperature affected Culicoides survival, virogenesis, and reassortment in Culicoides sonorensis coinfected with two BTV serotypes. Midges were fed blood meals containing BTV-10, BTV-17, or BTV serotype 10 and 17 and maintained at 20 °C, 25 °C, or 30 °C. Midge survival was assessed, and pools of midges were collected every other day to evaluate virogenesis of BTV via qRT-PCR. Additional pools of coinfected midges were collected for BTV plaque isolation. The genotypes of plaques were determined using next-generation sequencing. Warmer temperatures impacted traits related to vector competence in offsetting ways: BTV replicated faster in midges at warmer temperatures, but midges did not survive as long. Overall, plaques with BTV-17 genotype dominated, but BTV-10 was detected in some plaques, suggesting parental strain fitness may play a role in reassortment outcomes. Temperature adds an important dimension to host-pathogen interactions with implications for transmission and evolution.

Keywords: Culicoides; bluetongue virus; co-infection; next-generation sequencing; reassortment; temperature.


Conflict of interest statement

The authors declare no conflicts of interest. The funders had no role in the design of the study; in the collection, analyses, or interpretation of data; in the writing of the manuscript; or in the decision to publish the results.

Figures

Figure 1
Figure 1
Temperature and BTV infection status impacts C. sonorensis lifespan. Plots include all groups from both survival assay trials (experiment 2 and 3) with parametric survival regression models fit to each temperature separately (20 °C, 25 °C or 30 °C) with default Weibull distribution and robust sandwich error calculation. The plots consists of smooth lines for the survival regression curves of each infection group (BTV-10 in purple, BTV-17 in blue, BTV 10:BTV17 coinfected in green, and negative control in yellow) with the y-axis representing probability of survival and the x-axis representing days post infection. A Kaplan–Meier step curve is included for each group with a separate step curve for the repeated coinfected and negative control groups from experiment 3. Results are shown in associated tables that provide the mean survival days post infection, standard error (SE), and 95% confidence interval (CI) for individual curves and survival odds (Hazard ratio), SE, statistic (t.ratio), and p-value for comparisons between curves.
Figure 2
Figure 2
BTV Detected in all pools of the coinfected group. Pool size = 5 C. sonorensis. BTV detection was determined by pan BTV qRT-PCR. Black indicates BTV detected and gray indicates BTV not detected.
Figure 3
Figure 3
BTV virogenesis is similar across infection groups. Normalization of BTV Ct values calculated for each sample was accomplished using the ∆Ct method based on mean Ct values for BTV and cox1 (i.e., Pan BTV Ct−cox1 Ct). Due to the decreased survival of C. sonorensis at higher temperatures, data collection was limited for the 30 °C collection group. A linear model was fitted to each temperature (20 °C, 25 °C or 30 °C) separately with robust linear models applied to account for outliers. Some pools did not have detectable BTV and are represented by imputed values using multivariate imputation by chained equation with a Bayesian linear regression method and represented by triangles. Circles indicates data points. A third-degree polynomial was fit to Ct values for the 20 °C plot and second-degree polynomials were fit to Ct values for the 25 °C and 30 °C plots. Solid lines indicate the model curve, the shaded region represents the standard error, and the dash line is a curve based on the mean of the data at each day post infection. Pairwise comparisons were performed on the linear portions of the curves with a Tukey HSD adjustment. Estimates of the differences in linear trends, standard error, z-ratio statistic, and p-value are given for all comparisons.
Figure 4
Figure 4
BTV-17 is the predominant plaque genotype. Plaque genotypes that were sequenced from coinfected C. sonorensis are depicted by heat maps. (A) Represents plaque genotypes from pools that had qRT-PCR detection of only BTV-17 serotype. (B) Represents plaque genotypes from pools that had qRT-PCR detection of both BTV-17 and BTV10 serotypes. Each column represents an individual plaque with pools separated by white margins and labeled by dpi. Rows represents the ten BTV segments. Blue indicates that 100% of the sequencing reads for that segment aligned to BTV-10. Orange indicates that 100% of the sequencing reads for that segment aligned to BTV-17. A mixed color gradient indicates that the segment contains reads from both parental strains. X indicates insufficient reads.
Figure 5
Figure 5
Positive controls of BTV-10, BTV-17, and BTV-10:BTV-17 (at 50:50 ratio) were library prepped and sequenced with genotypes depicted by heatmaps. Rows represents the ten BTV segments. Blue indicates that 100% of the sequencing reads for that segment aligned to BTV-10. Orange indicates that 100% of the sequencing reads for that segment aligned to BTV-17. A mixed color gradient indicates that the segment contains reads from both parental strains.

References

    1. Navarro Mamani D.A., Ramos Huere H., Vera Buendia R., Rojas M., Chunga W.A., Valdez Gutierrez E., Vergara Abarca W., Rivera Gerónimo H., Altamiranda-Saavedra M. Would Climate Change Influence the Potential Distribution and Ecological Niche of Bluetongue Virus and Its Main Vector in Peru? Viruses. 2023;15:892. doi: 10.3390/v15040892. - DOI - PMC - PubMed
    1. Möhlmann T.W.R., Keeling M.J., Wennergren U., Favia G., Santman-Berends I., Takken W., Koenraadt C.J.M., Brand S.P.C. Biting Midge Dynamics and Bluetongue Transmission: A Multiscale Model Linking Catch Data with Climate and Disease Outbreaks. Sci. Rep. 2021;11:1892. doi: 10.1038/s41598-021-81096-9. - DOI - PMC - PubMed
    1. Spooner T., Jones A.E., Fearnley J., Savani R., Turner J., Baylis M. Bayesian Optimisation of Restriction Zones for Bluetongue Control. Sci. Rep. 2020;10:15139. doi: 10.1038/s41598-020-71856-4. - DOI - PMC - PubMed
    1. Purse B.V., Mellor P.S., Rogers D.J., Samuel A.R., Mertens P.P.C., Baylis M. Climate Change and the Recent Emergence of Bluetongue in Europe. Nat. Rev. Microbiol. 2005;3:171–181. doi: 10.1038/nrmicro1090. - DOI - PubMed
    1. Guis H., Caminade C., Calvete C., Morse A.P., Tran A., Baylis M. Modelling the Effects of Past and Future Climate on the Risk of Bluetongue Emergence in Europe. J. R. Soc. Interface. 2012;9:339–350. doi: 10.1098/rsif.2011.0255. - DOI - PMC - PubMed