

Profiling Cell Heterogeneity and Fructose Transporter Expression in the Rat Nephron by Integrating Single-Cell and Microdissected Tubule Segment Transcriptomes
- PMID: 38474316
- PMCID: PMC10931557
- DOI: 10.3390/ijms25053071
Profiling Cell Heterogeneity and Fructose Transporter Expression in the Rat Nephron by Integrating Single-Cell and Microdissected Tubule Segment Transcriptomes
Abstract
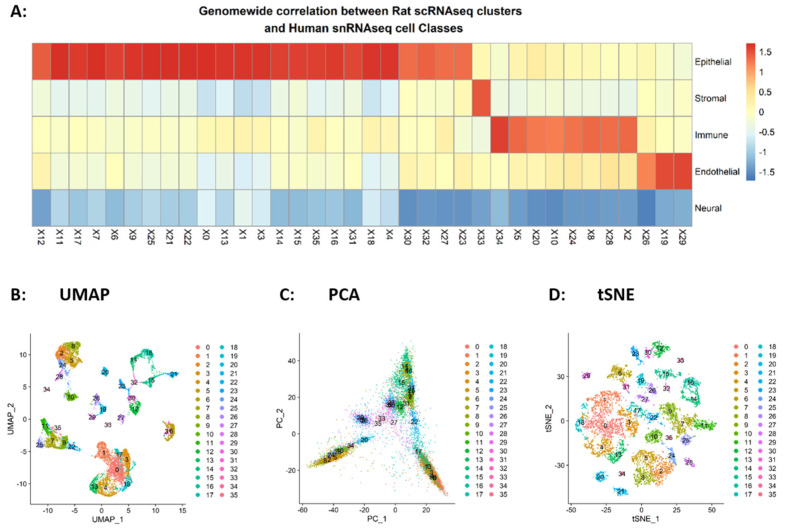
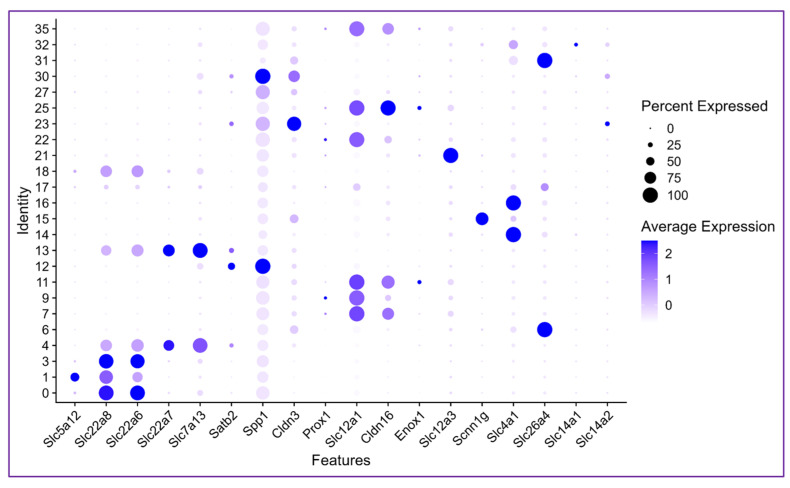
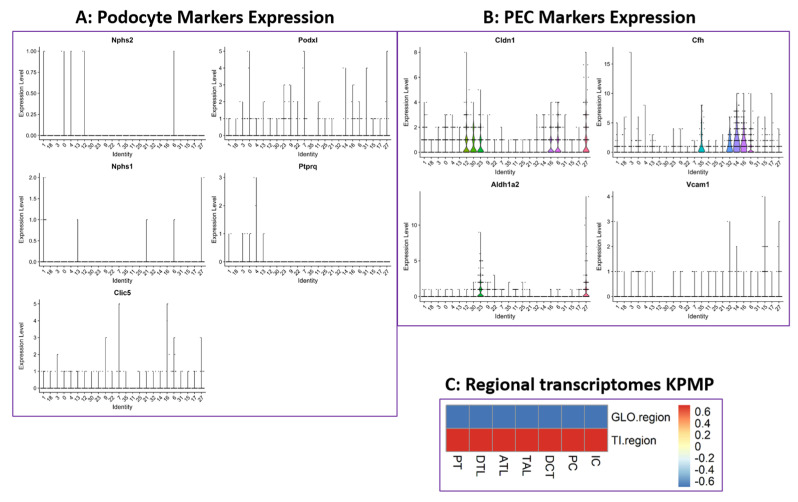
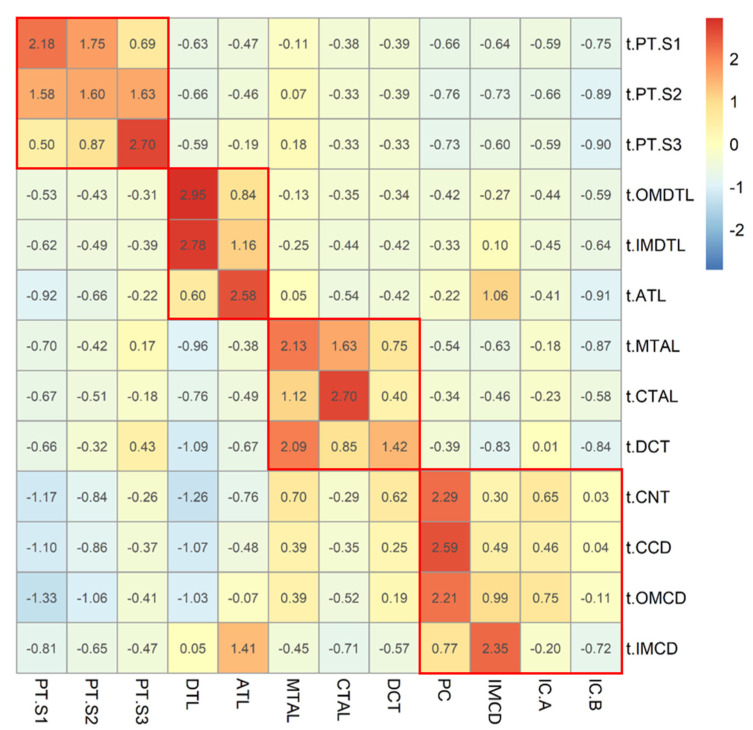
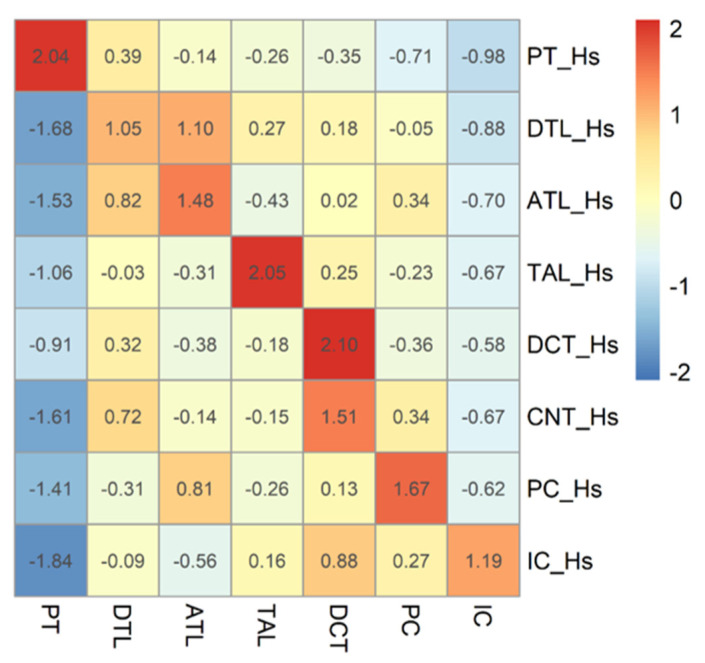
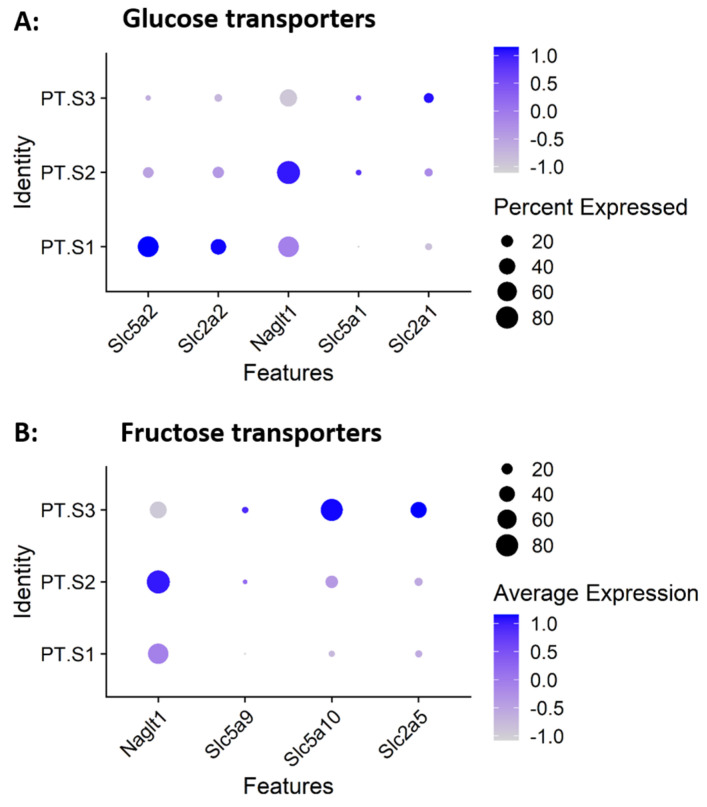
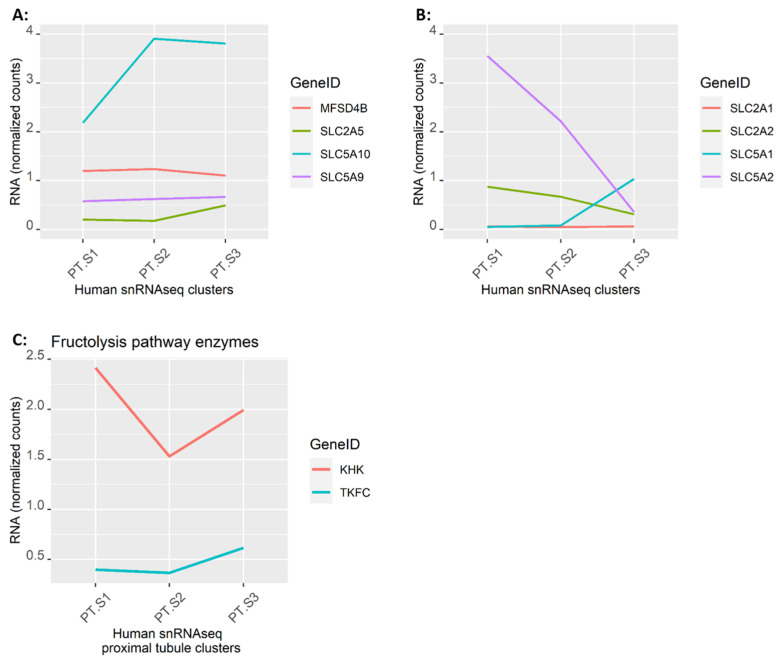
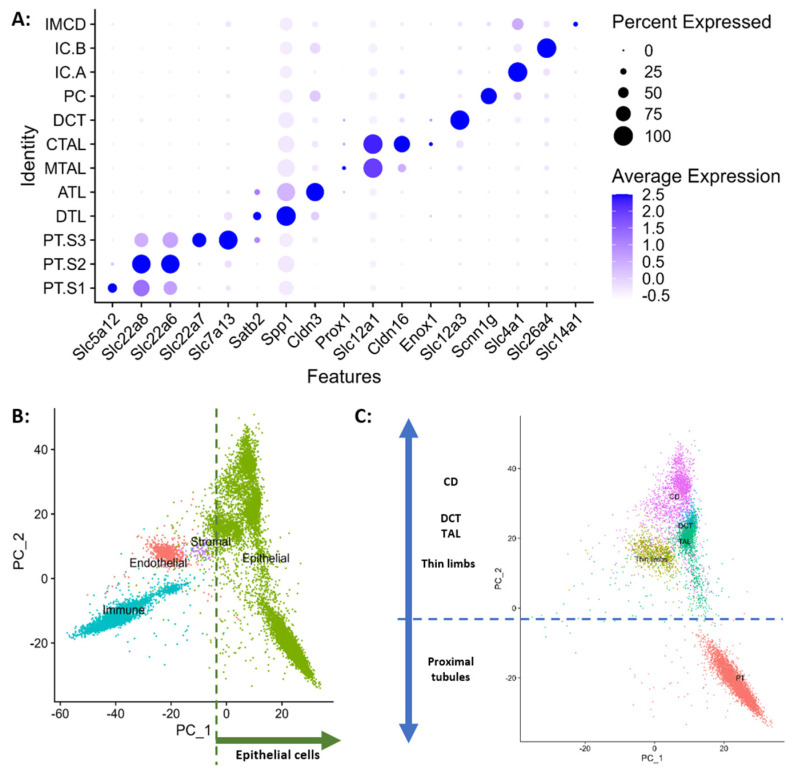
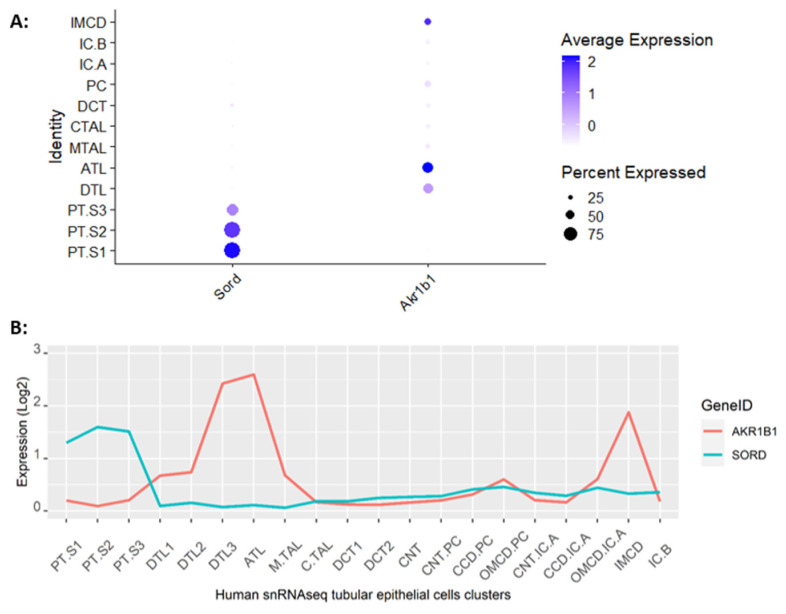
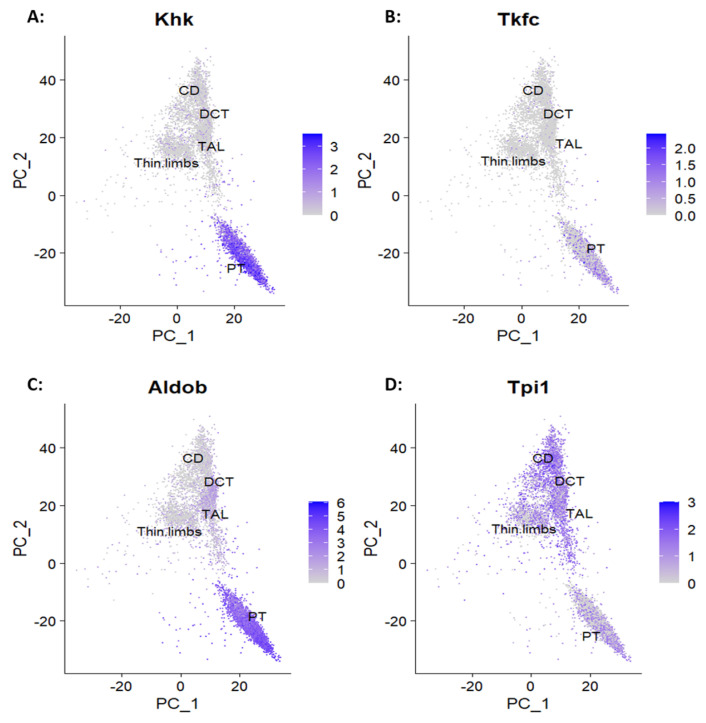
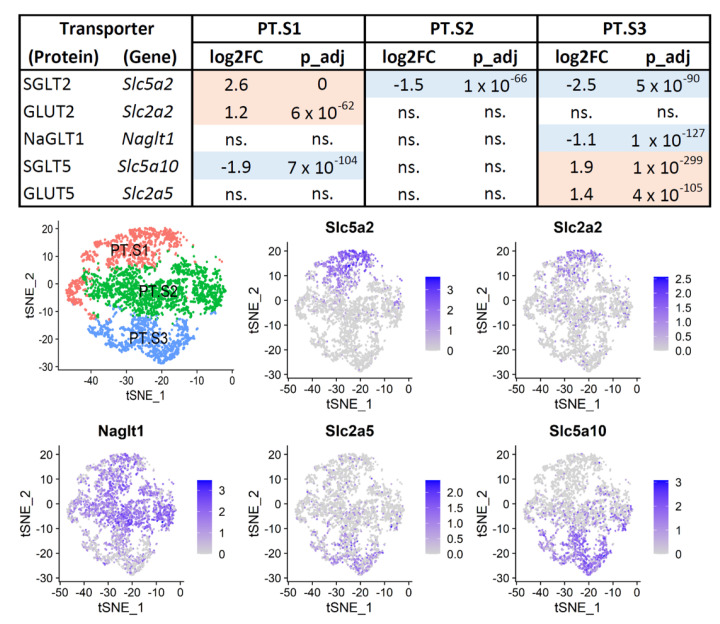
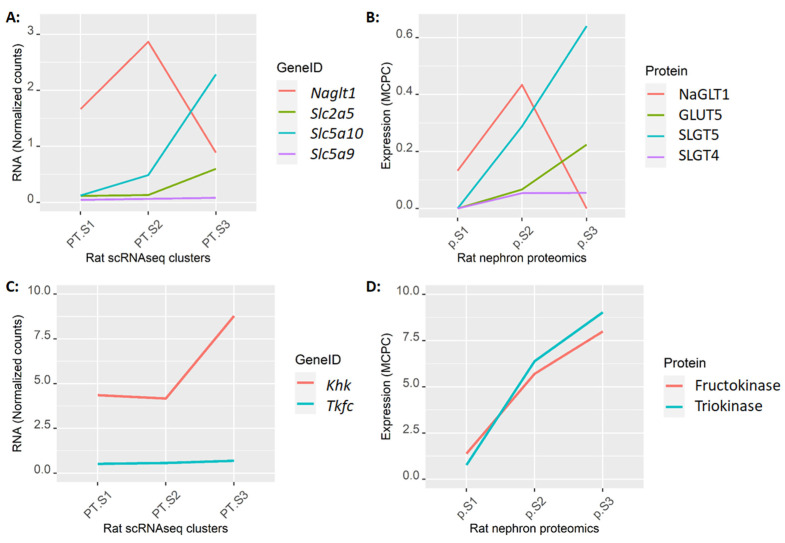
Single-cell RNA sequencing (scRNAseq) is a crucial tool in kidney research. These technologies cluster cells based on transcriptome similarity, irrespective of the anatomical location and order within the nephron. Thus, a transcriptome cluster may obscure the heterogeneity of the cell population within a nephron segment. Elevated dietary fructose leads to salt-sensitive hypertension, in part, through fructose reabsorption in the proximal tubule (PT). However, the organization of the four known fructose transporters in apical PTs (SGLT4, SGLT5, GLUT5, and NaGLT1) remains poorly understood. We hypothesized that cells within each subsegment of the proximal tubule exhibit complex, heterogeneous fructose transporter expression patterns. To test this hypothesis, we analyzed rat kidney transcriptomes and proteomes from publicly available scRNAseq and tubule microdissection databases. We found that microdissected PT-S1 segments consist of 81% ± 12% cells with scRNAseq-derived transcriptional characteristics of S1, whereas PT-S2 express a mixture of 18% ± 9% S1, 58% ± 8% S2, and 19% ± 5% S3 transcripts, and PT-S3 consists of 75% ± 9% S3 transcripts. The expression of all four fructose transporters was detectable in all three PT segments, but key fructose transporters SGLT5 and GLUT5 progressively increased from S1 to S3, and both were significantly upregulated in S3 vs. S1/S2 (Slc5a10: 1.9 log2FC, p < 1 × 10-299; Scl2a5: 1.4 log2FC, p < 4 × 10-105). A similar distribution was found in human kidneys. These data suggest that S3 is the primary site of fructose reabsorption in both humans and rats. Finally, because of the multiple scRNAseq transcriptional phenotypes found in each segment, our findings also imply that anatomical labels applied to scRNAseq clusters may be misleading.
Keywords: SGLT2 inhibitors; hexoses; salt-sensitive hypertension; sugar transport.
Conflict of interest statement
The authors declare no conflicts of interest. The funders had no role in the design of the study; in the collection, analyses, or interpretation of data; in the writing of the manuscript; or in the decision to publish the results.
Figures

Update of
-
Profiling cellular heterogeneity and fructose transporter expression in the rat nephron by integrating single-cell and microdissected tubule segment transcriptomes.bioRxiv [Preprint]. 2023 Dec 22:2023.12.20.572656. doi: 10.1101/2023.12.20.572656. bioRxiv. 2023. Update in: Int J Mol Sci. 2024 Mar 06;25(5):3071. doi: 10.3390/ijms25053071. PMID: 38187558 Free PMC article. Updated. Preprint.
Similar articles
-
Knocking Out Sodium Glucose-Linked Transporter 5 Prevents Fructose-Induced Renal Oxidative Stress and Salt-Sensitive Hypertension.Hypertension. 2024 Jun;81(6):1296-1307. doi: 10.1161/HYPERTENSIONAHA.123.22535. Epub 2024 Mar 28. Hypertension. 2024. PMID: 38545789 Free PMC article.
-
Profiling cellular heterogeneity and fructose transporter expression in the rat nephron by integrating single-cell and microdissected tubule segment transcriptomes.bioRxiv [Preprint]. 2023 Dec 22:2023.12.20.572656. doi: 10.1101/2023.12.20.572656. bioRxiv. 2023. Update in: Int J Mol Sci. 2024 Mar 06;25(5):3071. doi: 10.3390/ijms25053071. PMID: 38187558 Free PMC article. Updated. Preprint.
-
Fructose reabsorption by rat proximal tubules: role of Na+-linked cotransporters and the effect of dietary fructose.Am J Physiol Renal Physiol. 2019 Mar 1;316(3):F473-F480. doi: 10.1152/ajprenal.00247.2018. Epub 2018 Dec 19. Am J Physiol Renal Physiol. 2019. PMID: 30565998 Free PMC article.
-
Dietary fructose, salt absorption and hypertension in metabolic syndrome: towards a new paradigm.Acta Physiol (Oxf). 2011 Jan;201(1):55-62. doi: 10.1111/j.1748-1716.2010.02167.x. Acta Physiol (Oxf). 2011. PMID: 21143427 Free PMC article. Review.
-
Sodium-potassium-adenosinetriphosphatase-dependent sodium transport in the kidney: hormonal control.Physiol Rev. 2001 Jan;81(1):345-418. doi: 10.1152/physrev.2001.81.1.345. Physiol Rev. 2001. PMID: 11152761 Review.
Cited by
-
Knocking Out Sodium Glucose-Linked Transporter 5 Prevents Fructose-Induced Renal Oxidative Stress and Salt-Sensitive Hypertension.Hypertension. 2024 Jun;81(6):1296-1307. doi: 10.1161/HYPERTENSIONAHA.123.22535. Epub 2024 Mar 28. Hypertension. 2024. PMID: 38545789 Free PMC article.
References
-
- Su X.T., Reyes J.V., Lackey A.E., Demirci H., Bachmann S., Maeoka Y., Cornelius R.J., McCormick J.A., Yang C.L., Jung H.J., et al. Enriched Single-Nucleus RNA-Sequencing Reveals Unique Attributes of Distal Convoluted Tubule Cells. J. Am. Soc. Nephrol. 2024 doi: 10.1681/ASN.0000000000000297. online ahead of print . - DOI - PMC - PubMed
-
- National Bureau of Statistics of China. [(accessed on 18 September 2023)]; Available online: http://data.stats.gov.cn/easyquery.htm?cn=C01&zb=A0I0904&sj=2016.
-
- China Industrial Information. [(accessed on 28 September 2023)]. Available online: https://www.chyxx.com/industry/201405/248688.html.
MeSH terms
Substances
Grants and funding
- U01 DK114866/DK/NIDDK NIH HHS/United States
- U01 DK133097/DK/NIDDK NIH HHS/United States
- U01 DK114933/DK/NIDDK NIH HHS/United States
- U01 DK114907/DK/NIDDK NIH HHS/United States
- U01 DK114920/DK/NIDDK NIH HHS/United States
- U24 DK114886/DK/NIDDK NIH HHS/United States
- U01 DK133766/DK/NIDDK NIH HHS/United States
- U01 DK114923/DK/NIDDK NIH HHS/United States
- U01 DK133113/DK/NIDDK NIH HHS/United States
- U01 DK133090/DK/NIDDK NIH HHS/United States
- UH3 DK114915/DK/NIDDK NIH HHS/United States
- U01 DK133768/DK/NIDDK NIH HHS/United States
- UH3 DK114861/DK/NIDDK NIH HHS/United States
- U01 DK133092/DK/NIDDK NIH HHS/United States
- U01 DK114908/DK/NIDDK NIH HHS/United States
- K01 DK128304/DK/NIDDK NIH HHS/United States
- U01 DK133095/DK/NIDDK NIH HHS/United States
- DK123804/DK/NIDDK NIH HHS/United States
- UH3 DK114937/DK/NIDDK NIH HHS/United States
- U01 DK133081/DK/NIDDK NIH HHS/United States
- UH3 DK114926/DK/NIDDK NIH HHS/United States
- U01 DK133091/DK/NIDDK NIH HHS/United States
- U01 DK133093/DK/NIDDK NIH HHS/United States
LinkOut - more resources
Full Text Sources
