. 2024 Feb 27;13(5):411.
doi: 10.3390/cells13050411.

Red Blood Cell Storage with Xenon: Safe or Disruption?

Affiliations

Red Blood Cell Storage with Xenon: Safe or Disruption?

Ekaterina Sherstyukova et al. Cells. .

Abstract

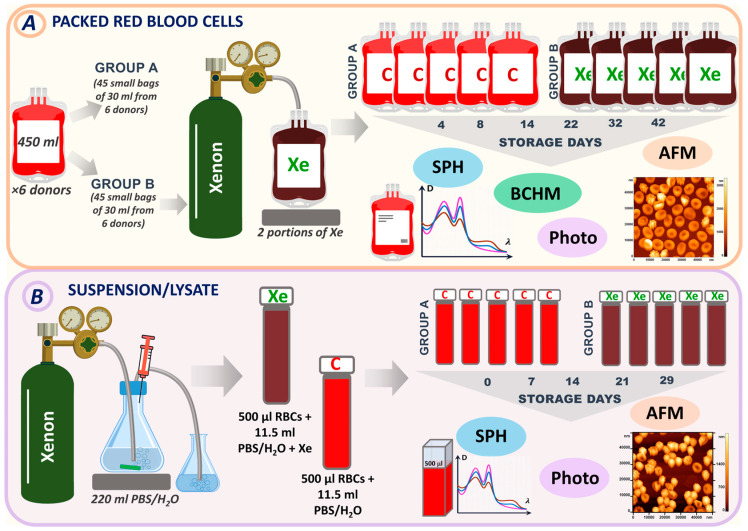
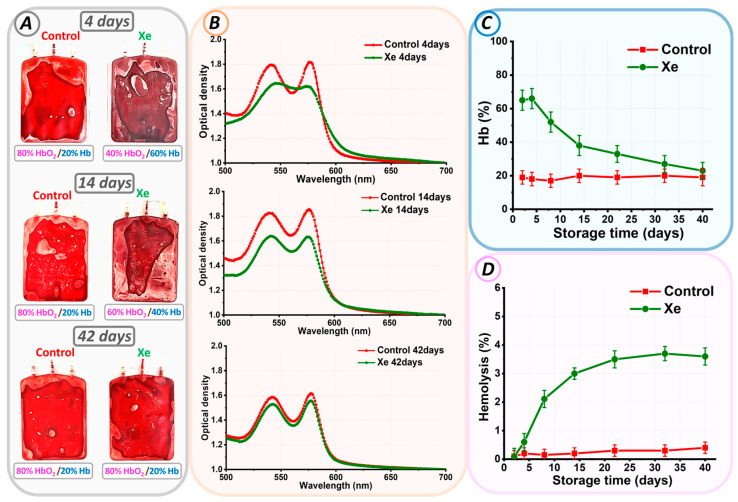
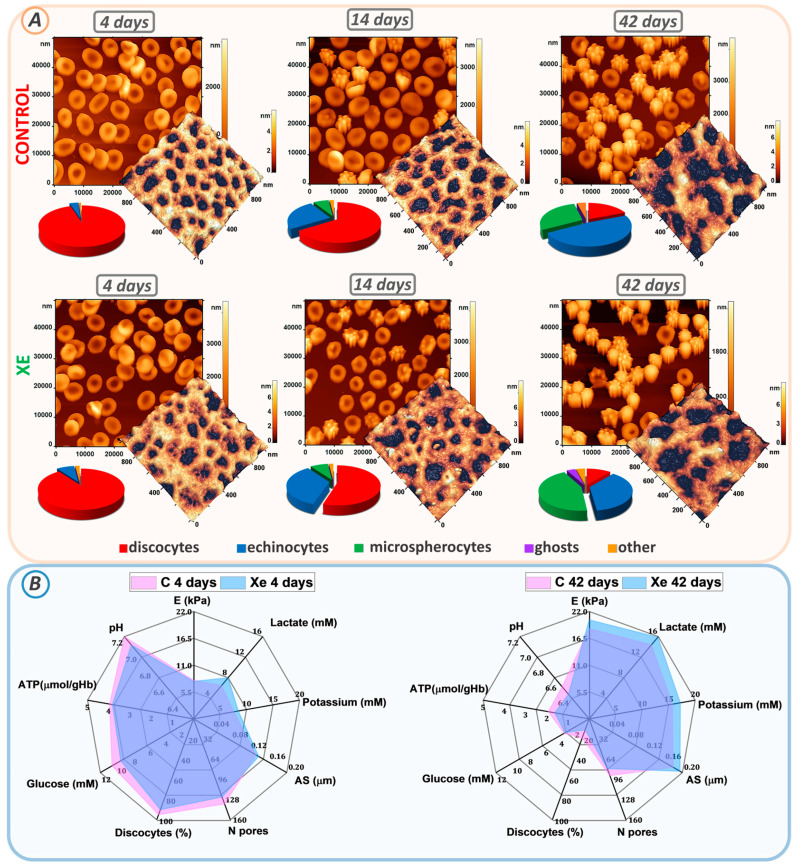
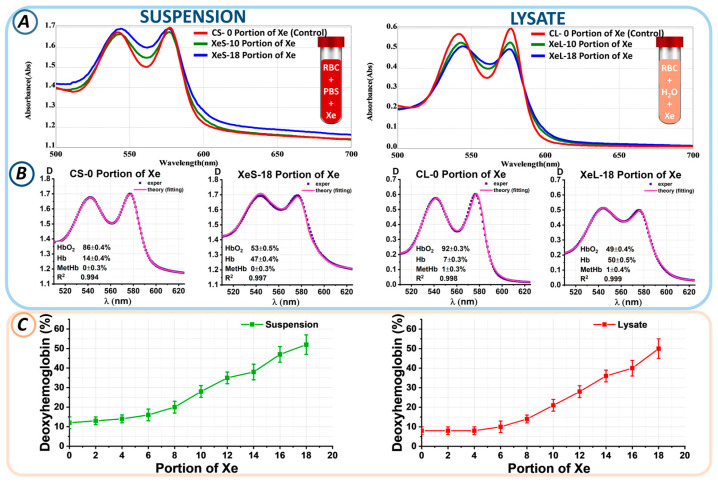
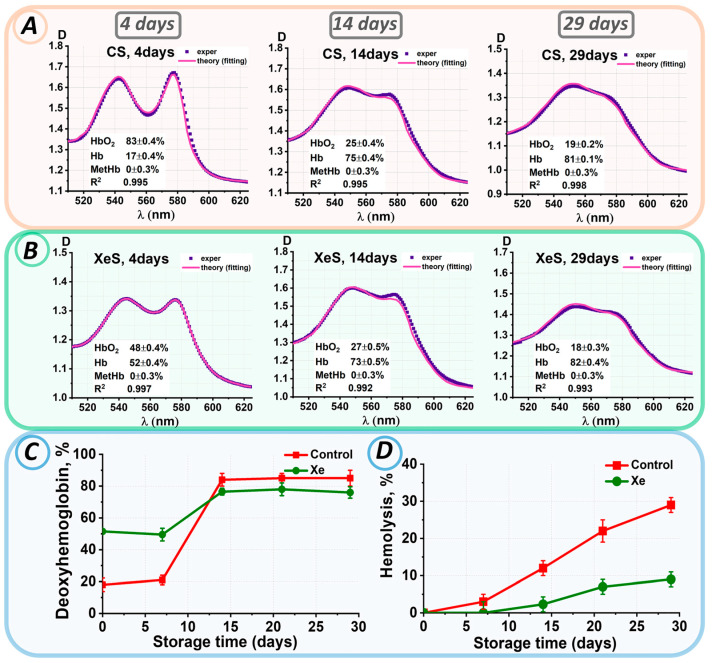
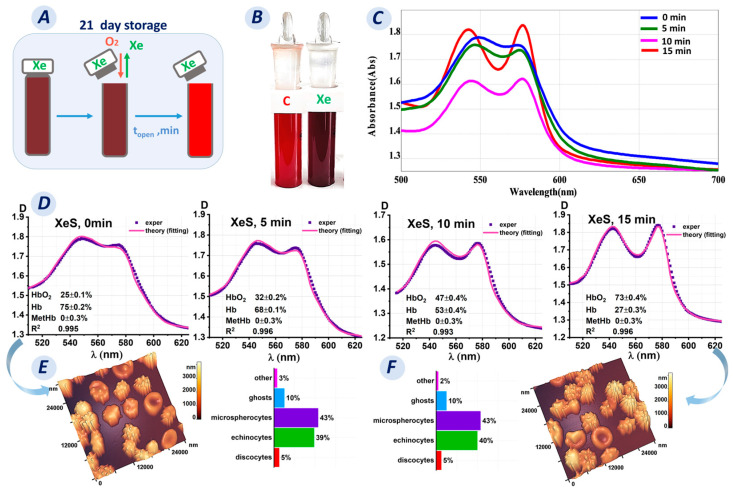
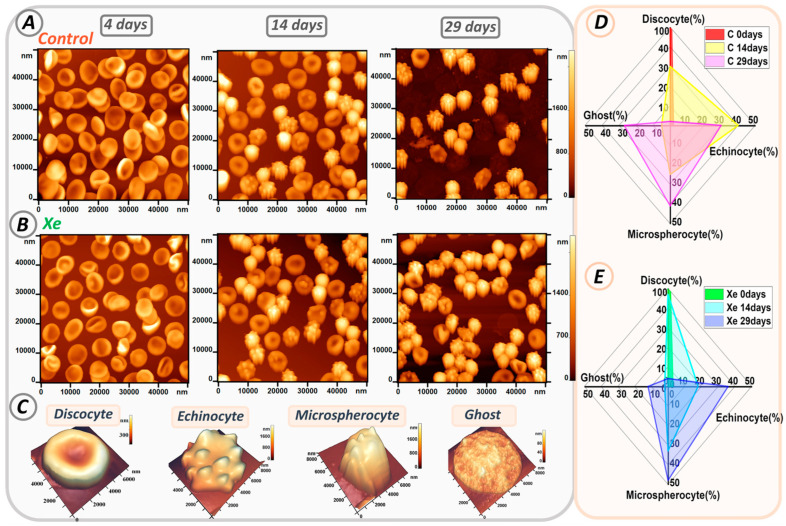
Xenon, an inert gas commonly used in medicine, has been considered as a potential option for prolonged preservation of donor packed red blood cells (pRBCs) under hypoxic conditions. This study aimed to investigate how xenon affects erythrocyte parameters under prolonged storage. In vitro model experiments were performed using two methods to create hypoxic conditions. In the first method, xenon was introduced into bags of pRBCs which were then stored for 42 days, while in the second method, xenon was added to samples in glass tubes. The results of our experiment showed that the presence of xenon resulted in notable alterations in erythrocyte morphology, similar to those observed under standard storage conditions. For pRBC bags, hemolysis during storage with xenon exceeded the acceptable limit by a factor of six, whereas the closed-glass-tube experiment showed minimal hemolysis in samples exposed to xenon. Notably, the production of deoxyhemoglobin was specific to xenon exposure in both cell suspension and hemolysate. However, this study did not provide evidence for the purported protective properties of xenon.

Keywords: AFM; blood storage; deoxyhemoglobin; in vitro study; membrane; red blood cells; spectrophotometry; xenon.


Conflict of interest statement

The authors declare no conflicts of interest.

Figures

Figure 1
Figure 1
Experimental design. (A) Experimental design for pRBCs (method 1). (B) Experimental design for RBC suspension/lysate (method 2). Samples were analyzed by spectrophotometry (SPH), atomic force microscopy (AFM), biochemical assays (BCHM), and photography. Bags that did not contain xenon and were used as controls were labeled C (Group A). Bags with injected xenon were labeled Xe (Group B).
Figure 2
Figure 2
Changes in parameters of pRBCs during storage. (A) Photograph of control pRBCs and pRBCs exposed to Xe on days 4, 14, and 42. The ratio of oxygen to Xe as HbO2/Hb is indicated for each bag. (B) Optical spectra of erythrocyte suspensions of control pRBCs and pRBCs exposed to Xe at days 4, 14, and 42. (C) Alteration in Hb% concentration relative to storage duration (days). (D) Variation in hemolysis rate (%) over storage duration (days).
Figure 3
Figure 3
Changes in erythrocyte morphology, cytoskeletal structure, and biochemical parameters during storage. (A) AFM 2D images of control and Xe-exposed erythrocytes taken at days 4, 14, and 42. Each image is accompanied by AFM 3D images of 1 × 1 μm2 cytoskeletal fragments and a scatterplot of the cell count distribution of different cell types. (B) Radar plots comparing the percentages of biochemical parameters (lactate, potassium, glucose, ATP, and pH), biomechanical properties (E), cytoskeletal properties (AS, N-pores), and percentage of discocytes at days 4 and 42 in control and Xe-exposed samples.
Figure 4
Figure 4
Changes in the levels of hemoglobin derivatives upon addition of a portion of Xe. (A) Optical spectra of suspension and lysate for the control sample and with different portions of Xe. (B) Example of fitting experimental data at 0 and 18 portions of Xe in RBC suspension and lysate. Here, 0 portions of Xe in suspension and lysate are labeled CS-0 portion of Xe and CL-0 portion of Xe (control samples), respectively; 18 portions of Xe in suspension and lysate are labeled XeS-18 portion of Xe and XeL-18 portion of Xe (xenon samples), respectively. The concentrations of hemoglobin derivatives shown in each graph were determined using the nonlinear curve-fitting method. (C) Change in Hb concentration (%) as a function of Xe portion in suspension and lysate.
Figure 5
Figure 5
Changes in the characteristics of the erythrocyte suspension during storage. Analysis of experimental data results: (A) for control samples and (B) for samples with added xenon at 0, 14, 29 days. The concentrations of hemoglobin derivatives were estimated by the nonlinear curve-fitting approach and are presented in each graph as value ± SE. (C) Change in Hb concentration (%) during storage in control and xenon-exposed samples. (D) Change in % hemolysis for control and xenon-exposed samples.
Figure 6
Figure 6
Transformation of hemoglobin derivatives upon opening a test tube after incubation for 21 days of storage. (A) Schematic representation of the change in oxygen concentration in a test tube after opening on day 21. (B) Photograph of the control tube (not saturated with Xe) and the tube with Xe on day 21. (C) Optical spectra as a function of the time of opening the tube containing Xe. (D) Fitting results of the experimental data for the Xe-exposed sample after opening at 5, 10, and 15 min. (E,F) AFM 3D images and graphs plots showing the number of cells with different shapes in the Xe-exposed samples before opening the tube and 15 min after opening.
Figure 7
Figure 7
Alterations in erythrocyte shape during storage in glass tubes. (A) AFM 2D images of cells from control samples on days 0, 14, and 29. (B) AFM 2D images of cells from Xe-exposed samples on days 0, 14, and 29. (C) Typical cell shapes. (D,E) Radar plot showing the percentage of typical cell shapes in control and Xe-exposed samples on days 0, 14, and 29.

Similar articles

Cited by

References

    1. Jiao C., Zheng L. Blood Transfusion-Related Immunomodulation in Patients with Major Obstetric Haemorrhage. Vox Sang. 2019;114:861–868. doi: 10.1111/vox.12845. - DOI - PubMed
    1. Culp-Hill R., Srinivasan A.J., Gehrke S., Kamyszek R., Ansari A., Shah N., Welsby I., D’Alessandro A. Effects of Red Blood Cell (RBC) Transfusion on Sickle Cell Disease Recipient Plasma and RBC Metabolism. Transfusion. 2018;58:2797–2806. doi: 10.1111/trf.14931. - DOI - PMC - PubMed
    1. Hood A.M., King A.A., Fields M.E., Ford A.L., Guilliams K.P., Hulbert M.L., Lee J.-M., White D.A. Higher Executive Abilities Following a Blood Transfusion in Children and Young Adults with Sickle Cell Disease. Pediatr. Blood Cancer. 2019;66:e27899. doi: 10.1002/pbc.27899. - DOI - PMC - PubMed
    1. Thurn L., Wikman A., Westgren M., Lindqvist P.G. Massive Blood Transfusion in Relation to Delivery: Incidence, Trends and Risk Factors: A Population-Based Cohort Study. BJOG. 2019;126:1577–1586. doi: 10.1111/1471-0528.15927. - DOI - PubMed
    1. Moroz V.V., Sherstyukova E.A., Kozlova E.K., Sergunova V.A. Storage Time of Filtered Red Blood Cells and Post-Transfusion Complications (Review) Gen. Reanimatol. 2021;17:69–82. doi: 10.15360/1813-9779-2021-1-69-82. - DOI

LinkOut - more resources