

Dietary Sodium Restriction and Frailty among Middle-Aged and Older Adults: An 8-Year Longitudinal Study
- PMID: 38474709
- PMCID: PMC10933923
- DOI: 10.3390/nu16050580
Dietary Sodium Restriction and Frailty among Middle-Aged and Older Adults: An 8-Year Longitudinal Study
Abstract
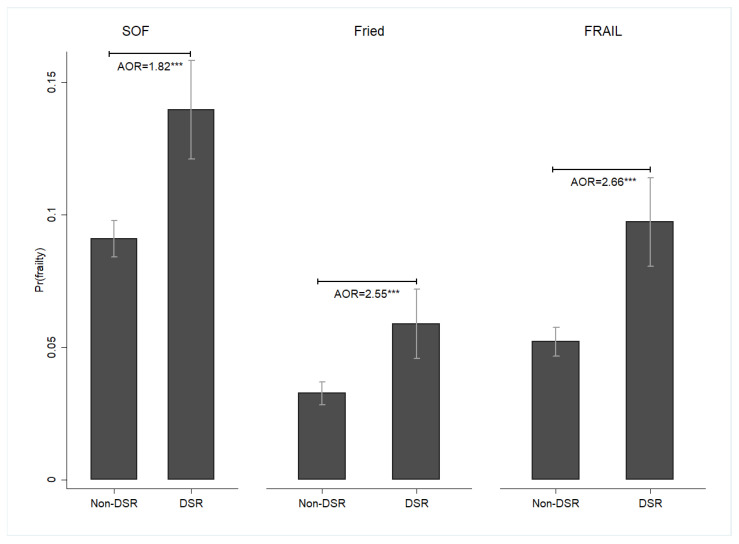
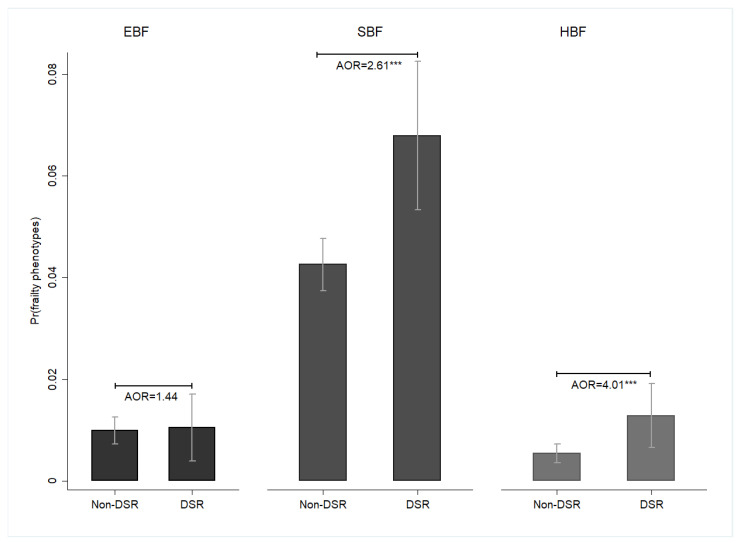
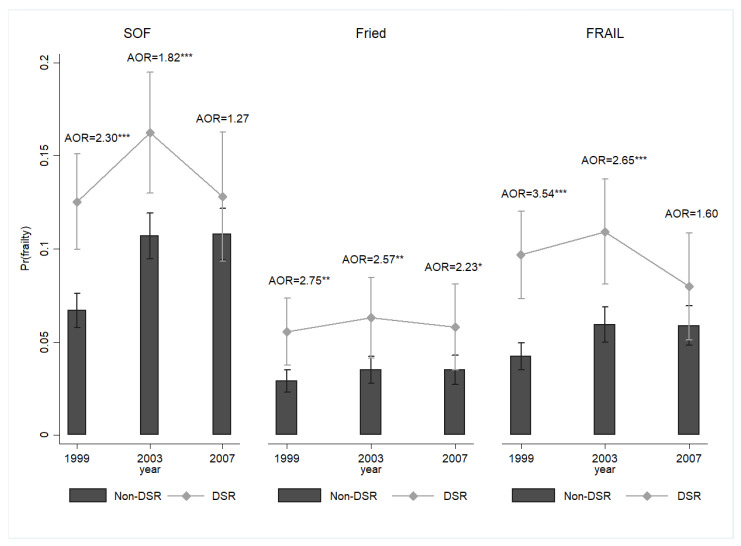
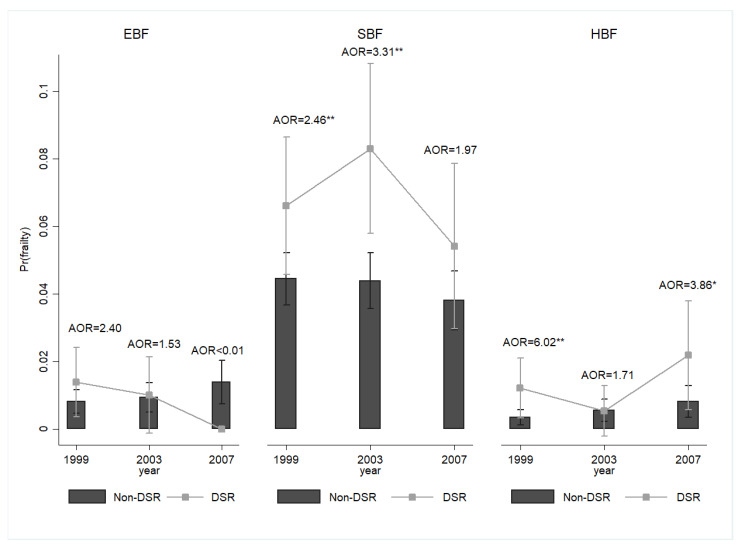
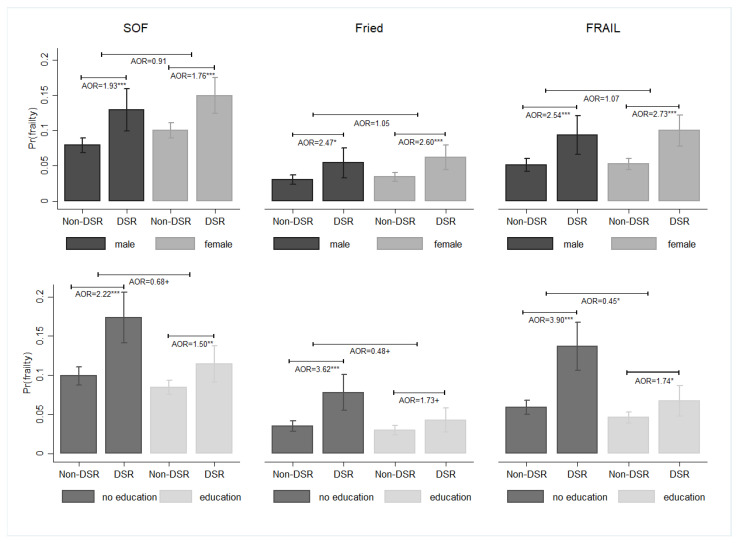
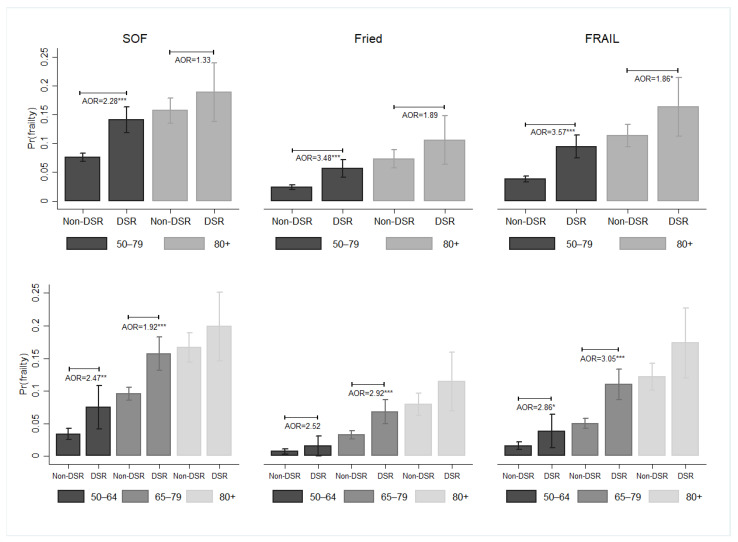
Frailty is a common geriatric syndrome. However, there is little information about the relationship between dietary sodium restriction (DSR) and frailty in later life. This study aimed to elucidate the relationship between DSR and frailty in middle-aged and older adults. The 8-year follow-up data from the Taiwan Longitudinal Study on Aging, including 5131 individuals aged ≥50 years, were analyzed using random-effects panel logit models. DSR was evaluated by assessing whether the participants were told by a physician to reduce or avoid sodium intake from food. Three indices were used to measure frailty: the Study of Osteoporotic Fractures (SOF) index, the Fried index, and the Fatigue, Resistance, Ambulation, Illness, and Loss of weight (FRAIL) index. Individuals with DSR were more likely to report frailty compared with those with non-DSR (SOF: adjusted odds ratio [AOR] = 1.82, 95% confidence interval [CI] = 1.46-2.27; Fried: AOR = 2.55, 95% CI = 1.64-3.98; FRAIL: AOR = 2.66, 95% CI = 1.89-3.74). DSR was associated with a higher likelihood of SBF (AOR = 2.61, 95% CI = 1.61-4.22). We identified a temporal trajectory in our study, noting significant participant reactions to both short- and mid-term DSR. Future research should address the balance between frailty risk and cardiovascular risk related to DSR.
Keywords: dietary sodium restriction; frailty; frailty phenotypes; older adults.
Conflict of interest statement
The authors declare no conflicts of interest.
Figures
Similar articles
-
Impact of dietary sodium restriction on falls among middle-aged and older adults: Results of an 8-year longitudinal study.Geriatr Gerontol Int. 2024 Mar;24 Suppl 1:292-299. doi: 10.1111/ggi.14669. Epub 2023 Sep 17. Geriatr Gerontol Int. 2024. PMID: 37718504
-
Frailty phenotypes and their association with health consequences: a comparison of different measures.Aging Clin Exp Res. 2024 Dec 3;36(1):233. doi: 10.1007/s40520-024-02887-4. Aging Clin Exp Res. 2024. PMID: 39625598 Free PMC article. Review.
-
Predicting frailty in older adults using vocal biomarkers: a cross-sectional study.BMC Geriatr. 2022 Jul 1;22(1):549. doi: 10.1186/s12877-022-03237-7. BMC Geriatr. 2022. PMID: 35778699 Free PMC article.
-
Two-year longitudinal associations between nutritional status and frailty in community-dwelling older adults: Korean Frailty and Aging Cohort Study.BMC Geriatr. 2023 Apr 5;23(1):216. doi: 10.1186/s12877-023-03903-4. BMC Geriatr. 2023. PMID: 37020292 Free PMC article.
-
Longitudinal association between eating alone and deterioration in frailty status: The Korean Frailty and Aging Cohort Study.Exp Gerontol. 2023 Feb;172:112078. doi: 10.1016/j.exger.2022.112078. Epub 2022 Dec 28. Exp Gerontol. 2023. PMID: 36584805 Review.
Cited by
-
Rethinking salt reduction in older adults with hypertension.Hypertens Res. 2025 Apr;48(4):1442-1443. doi: 10.1038/s41440-025-02138-7. Epub 2025 Feb 12. Hypertens Res. 2025. PMID: 39939829 No abstract available.
-
Identifying and Estimating Frailty Phenotypes by Vocal Biomarkers: Cross-Sectional Study.J Med Internet Res. 2024 Nov 8;26:e58466. doi: 10.2196/58466. J Med Internet Res. 2024. PMID: 39515817 Free PMC article.
References
-
- Vermeiren S., Vella-Azzopardi R., Beckwée D., Habbig A.K., Scafoglieri A., Jansen B., Bautmans I., Gerontopole Brussels Study group Frailty and the prediction of negative health outcomes: A meta-analysis. J. Am. Med. Dir. Assoc. 2016;17:1163.e1–1163.e17. doi: 10.1016/j.jamda.2016.09.010. - DOI - PubMed
-
- Bollwein J., Volkert D., Diekmann R., Kaiser M.J., Uter W., Vidal K., Sieber C.C., Bauer J.M. Nutritional status according to the mini nutritional assessment (MNA®) and frailty in community dwelling older persons: A close relationship. J. Nutr. Health Aging. 2013;17:351–356. doi: 10.1007/s12603-013-0034-7. - DOI - PubMed
MeSH terms
Substances
Grants and funding
LinkOut - more resources
Full Text Sources
Medical
