

Postprandial Micronutrient Variability and Bioavailability: An Interventional Meal Study in Young vs. Old Participants
- PMID: 38474753
- PMCID: PMC10934810
- DOI: 10.3390/nu16050625
Postprandial Micronutrient Variability and Bioavailability: An Interventional Meal Study in Young vs. Old Participants
Abstract
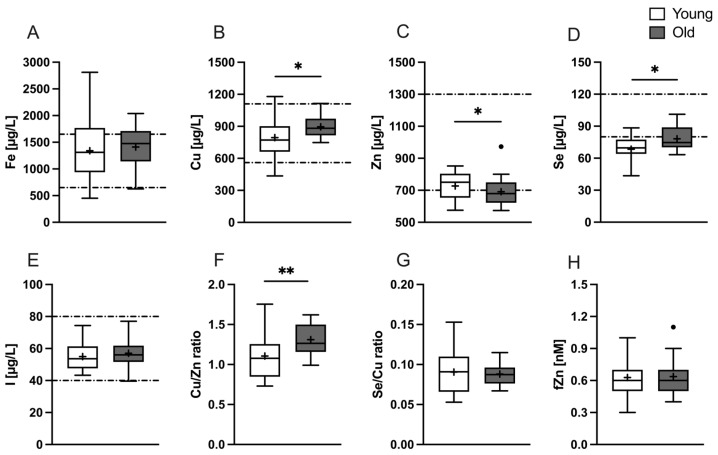
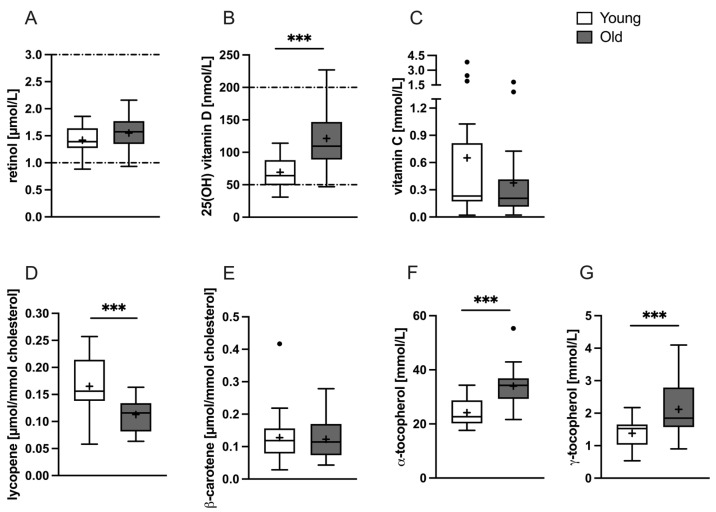
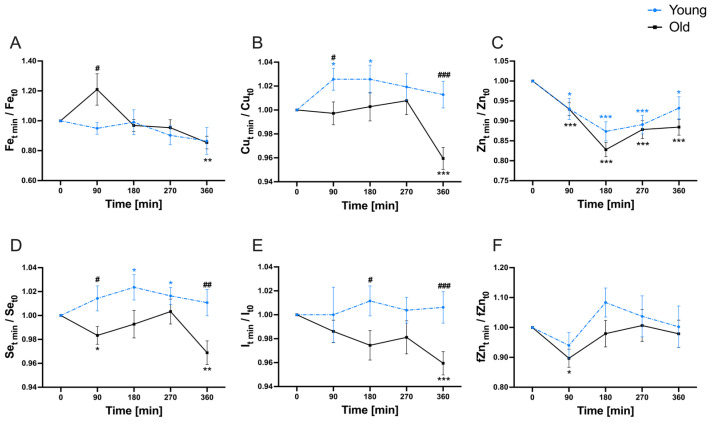
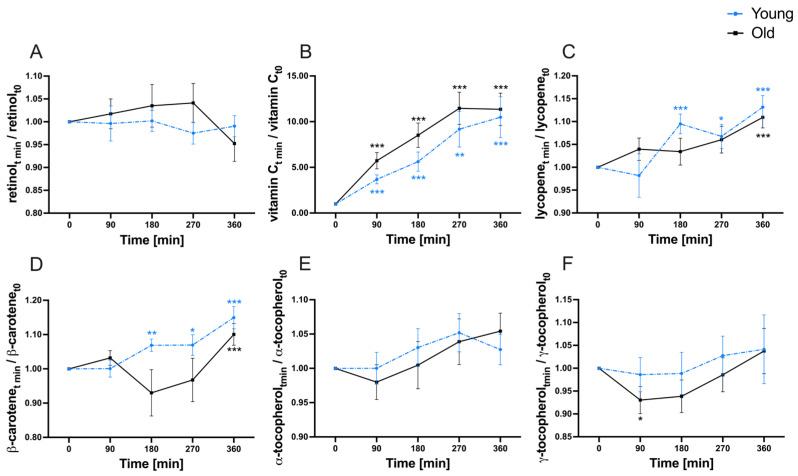
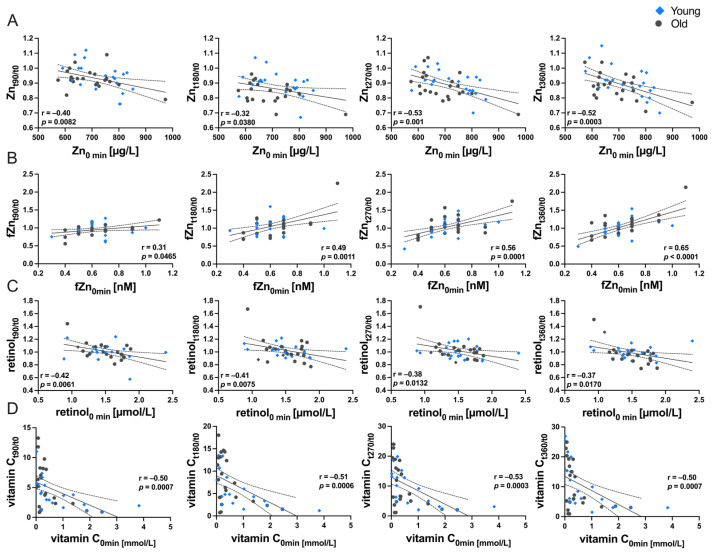
This study explores age- and time-dependent variations in postprandial micronutrient absorption after a micronutrient-rich intervention meal within the Biomiel (bioavailability of micronutrients in elderly) study. Comprising 43 healthy participants, the study compares young (n = 21; mean age 26.90 years) and old (n = 22; mean age 66.77 years) men and women, analyzing baseline concentrations and six-hour postprandial dynamics of iron (Fe), copper (Cu), zinc (Zn), selenium (Se), iodine (I), free zinc (fZn), vitamin C, retinol, lycopene, β-carotene, α-tocopherol, and γ-tocopherol, along with 25(OH) vitamin D (quantified only at baseline). Methodologically, quantifications in serum or plasma were performed at baseline and also at 90, 180, 270, and 360 min postprandially. Results reveal higher baseline serum Zn and plasma lycopene concentrations in the young group, whereas Cu, Se, Cu/Zn ratio, 25(OH) vitamin D, α-tocopherol, and γ-tocopherol were higher in old participants. Postprandial variability of Zn, vitamin C, and lycopene showed a strong time-dependency. Age-related differences in postprandial metabolism were observed for Se, Cu, and I. Nevertheless, most of the variance was explained by individuality. Despite some limitations, this study provides insights into postprandial micronutrient metabolism (in serum/plasma), emphasizing the need for further research for a comprehensive understanding of this complex field. Our discoveries offer valuable insights for designing targeted interventions to address and mitigate micronutrient deficiencies in older adults, fostering optimal health and well-being across the lifespan.
Keywords: carotenoids; interventional meal study; old; postprandial assessment; trace elements; vitamins; young.
Conflict of interest statement
The authors declare no conflicts of interest.
Figures
Similar articles
-
Changes in serum retinol, alpha-tocopherol, vitamin C, carotenoids, xinc and selenium after micronutrient supplementation during alcohol rehabilitation.J Am Coll Nutr. 2003 Aug;22(4):303-10. doi: 10.1080/07315724.2003.10719308. J Am Coll Nutr. 2003. PMID: 12897045 Clinical Trial.
-
Micronutrient status in elderly people. Geriatrie/Min. Vit. Aux Network.Int J Vitam Nutr Res. 1996;66(1):71-6. Int J Vitam Nutr Res. 1996. PMID: 8698550
-
Serum concentrations of micronutrient antioxidants in an adult Arab population.Asia Pac J Clin Nutr. 2002;11(1):22-7. doi: 10.1046/j.1440-6047.2002.00260.x. Asia Pac J Clin Nutr. 2002. PMID: 11890634
-
Plasma fat-soluble vitamin and carotenoid concentrations after plant sterol and plant stanol consumption: a meta-analysis of randomized controlled trials.Eur J Nutr. 2017 Apr;56(3):909-923. doi: 10.1007/s00394-016-1289-7. Epub 2016 Sep 3. Eur J Nutr. 2017. PMID: 27591863 Free PMC article. Review.
-
Clinical pharmacokinetics of antioxidants and their impact on systemic oxidative stress.Clin Pharmacokinet. 2003;42(5):437-59. doi: 10.2165/00003088-200342050-00003. Clin Pharmacokinet. 2003. PMID: 12739983 Review.
Cited by
-
The associations between serum carotenoids and hyperuricemia among U.S. National Health and Nutrition Examination Survey.BMC Public Health. 2025 Apr 4;25(1):1278. doi: 10.1186/s12889-025-22060-4. BMC Public Health. 2025. PMID: 40186198 Free PMC article.
References
-
- Bornhorst J., Kipp A.P., Haase H., Meyer S., Schwerdtle T. The Crux of Inept Biomarkers for Risks and Benefits of Trace Elements. TrAC Trends Anal. Chem. 2018;104:183–190. doi: 10.1016/j.trac.2017.11.007. - DOI
MeSH terms
Substances
Grants and funding
LinkOut - more resources
Full Text Sources
