. 2024 Feb 23;16(5):626.
doi: 10.3390/nu16050626.

Metabolic Dysfunction-Associated Steatotic Liver Disease in a Dish: Human Precision-Cut Liver Slices as a Platform for Drug Screening and Interventions

Affiliations

Metabolic Dysfunction-Associated Steatotic Liver Disease in a Dish: Human Precision-Cut Liver Slices as a Platform for Drug Screening and Interventions

Mei Li et al. Nutrients. .

Abstract

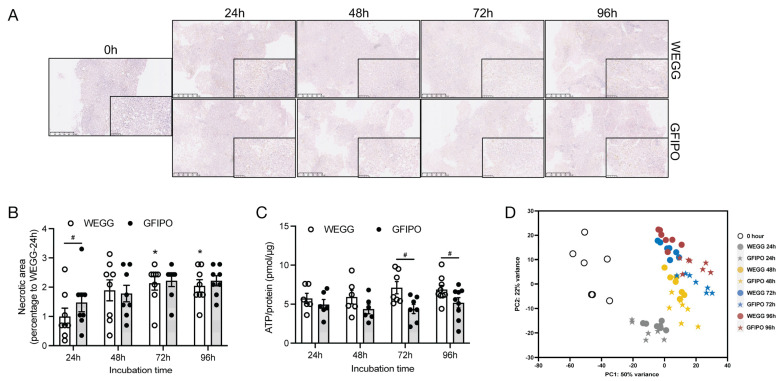
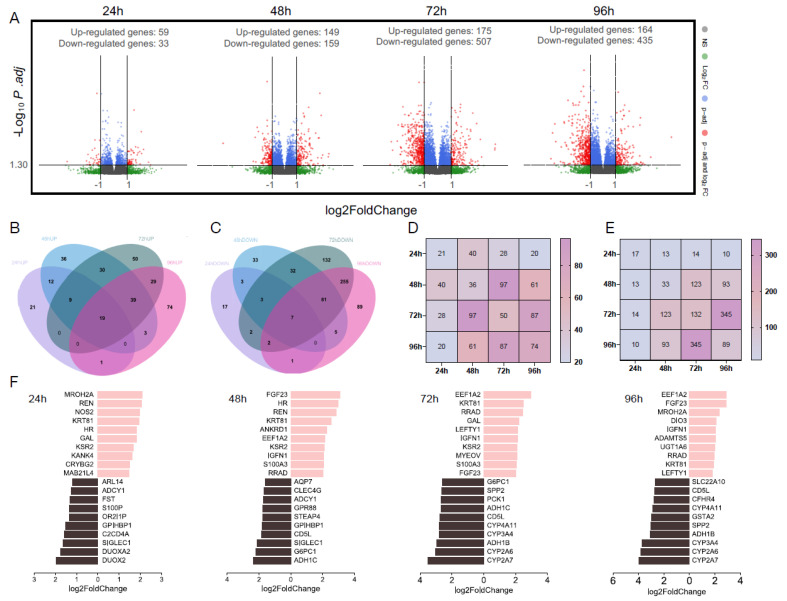
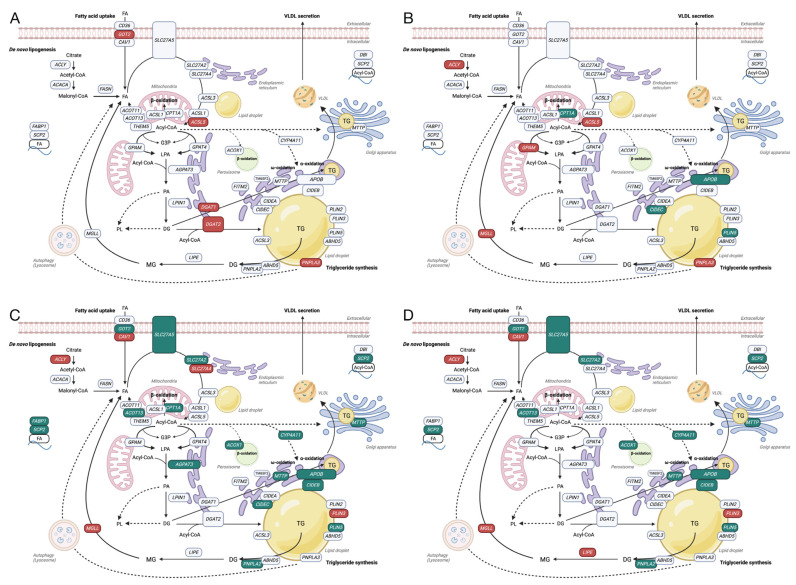
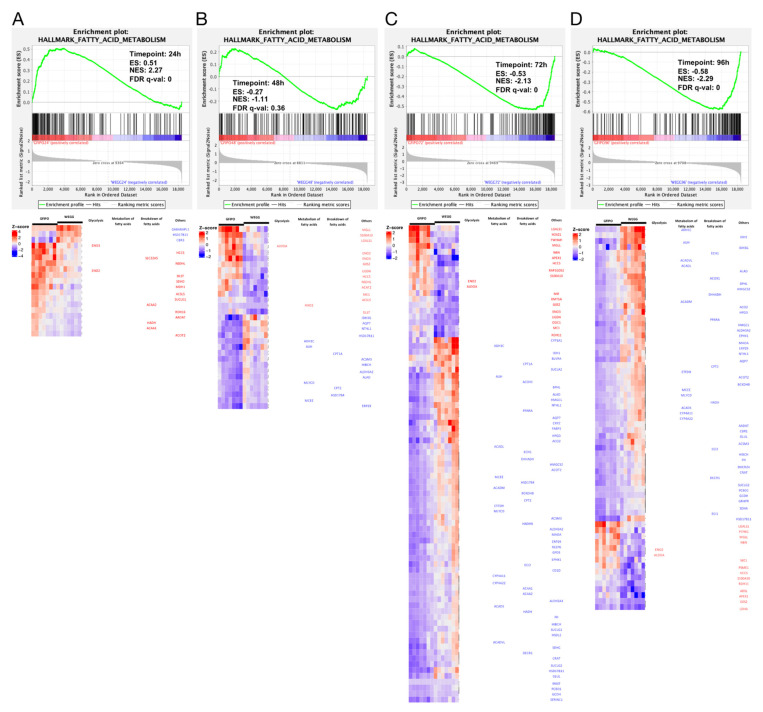
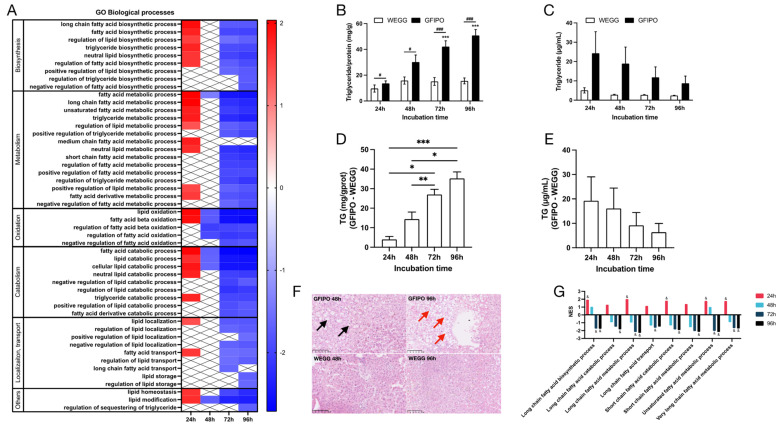
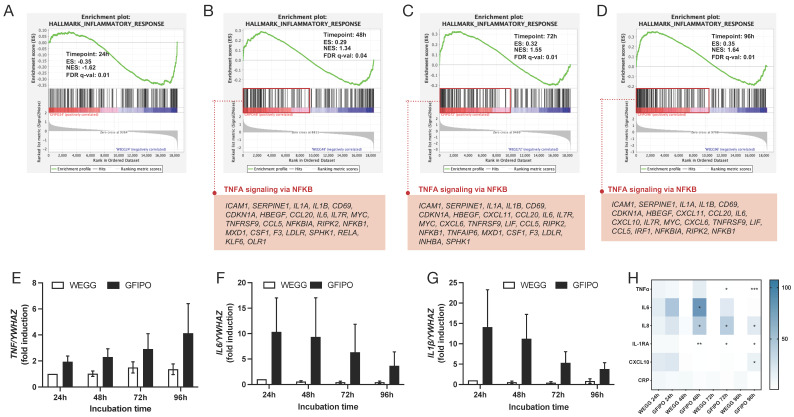
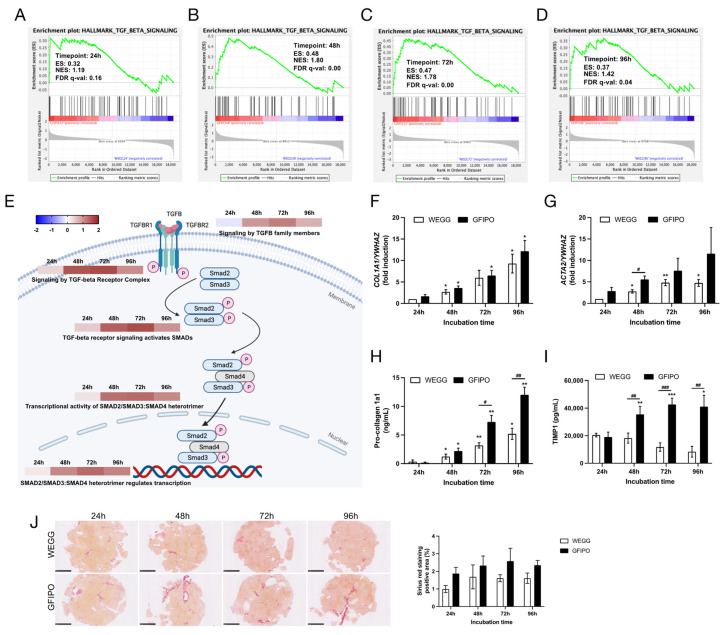
Metabolic dysfunction-associated steatotic liver disease (MASLD) is a growing healthcare problem with limited therapeutic options. Progress in this field depends on the availability of reliable preclinical models. Human precision-cut liver slices (PCLSs) have been employed to replicate the initiation of MASLD, but a comprehensive investigation into MASLD progression is still missing. This study aimed to extend the current incubation time of human PCLSs to examine different stages in MASLD. Healthy human PCLSs were cultured for up to 96 h in a medium enriched with high sugar, high insulin, and high fatty acids to induce MASLD. PCLSs displayed hepatic steatosis, characterized by accumulated intracellular fat. The development of hepatic steatosis appeared to involve a time-dependent impact on lipid metabolism, with an initial increase in fatty acid uptake and storage, and a subsequent down-regulation of lipid oxidation and secretion. PCLSs also demonstrated liver inflammation, including increased pro-inflammatory gene expression and cytokine production. Additionally, liver fibrosis was also observed through the elevated production of pro-collagen 1a1 and tissue inhibitor of metalloproteinase-1 (TIMP1). RNA sequencing showed that the tumor necrosis factor alpha (TNFα) signaling pathway and transforming growth factor beta (TGFβ) signaling pathway were consistently activated, potentially contributing to the development of inflammation and fibrosis. In conclusion, the prolonged incubation of human PCLSs can establish a robust ex vivo model for MASLD, facilitating the identification and evaluation of potential therapeutic interventions.

Keywords: hepatic steatosis; liver fibrosis; long-term incubation; metabolic dysfunction-associated steatotic liver disease (MASLD); non-alcoholic fatty liver disease (NAFLD); precision-cut liver slices (PCLSs).


Conflict of interest statement

The authors declare no conflicts of interest.

Figures

Figure 1
Figure 1
Initial characterization of human PCLSs, cultured for up to 96 h in WEGG or GFIPO. (A) Representative H&E staining images of PCLSs after long-term incubation in WEGG and GFIPO. Scale bar = 500 µm; inset: 100 µm. (B) Presence of necrotic areas compared to WEGG 24 h in H&E staining. (C) ATP/protein content in PCLSs after up to 96 h incubation in WEGG or GFIPO. (D) PCA showing the first two principal components. Each symbol corresponds to an individual patient sample composed of 3 slices, with a total of 7 patients (n = 7) assessed in each group. Data are presented as mean ± SEM. (#) denotes statistical differences between GFIPO and WEGG at each time point, while (*) denotes statistical differences in GFIPO or WEGG compared to their corresponding 24 h; *(#) p < 0.05.
Figure 2
Figure 2
NGS of PCLSs, cultured for up to 96 h in WEGG or GFIPO. (A) Volcano plots representing the differentially expressed genes (red), with a threshold of log2FoldChange > 1 on the x-axis and p.adj < 0.05 (−Log10p.adj > 1.30) on the y-axis, comparing GFIPO and WEGG at each time point. WEGG serves as the control group. (B,C) Venn diagrams illustrating the distribution of up-regulated genes (B) and down-regulated genes (C) across all time points. (D,E) Heatmap showing the number of overlapped up-regulated (D) and down-regulated (E) DEGs between two timepoints; overlap of the same timepoint stands for the unique DEGs amount as shown in the Venn diagrams. (F) The top 10 up-regulated genes (highlighted in pink, right) and down-regulated genes (highlighted in black, left) at each time point.
Figure 3
Figure 3
Gene regulation in fatty acid metabolism pathways by GFIPO compared to WEGG. (AD) Up-regulated (in red) or down-regulated (in green) DEGs associated with fatty acid metabolism induced by GFIPO compared to WEGG at 24 h (A), 48 h (B), 72 h (C), and 96 h (D) of incubation.
Figure 4
Figure 4
Gene regulation in fatty acid metabolism pathways by GFIPO compared to WEGG as identified by Gene Set Enrichment Analysis (GSEA). (AD) GSEA plots of the hallmark fatty acid metabolism pathway at each time point: (A) 24 h, (B) 48 h, (C) 72 h, and (D) 96 h; below are significantly dysregulated genes in this pathway.
Figure 5
Figure 5
Fatty acid metabolism pathways by GFIPO compared to WEGG as identified by Gene Set Enrichment Analysis (GSEA) and phenotype of triglyceride regulation. (A) Altered biological processes associated with lipid, fatty acid, and TG metabolisms (nominal p. value < 0.01) at each time point, ranked by the normalized enrichment score (NES) value on the scale bar (NES > 0, up-regulated; NES < 0, down-regulated). (B,C) Increase in TG content relative to control at 0 h in PCLSs (B) or medium (C) after up to 96 h incubation in WEGG or GFIPO. D-E Differences in TG increase between GFIPO and WEGG in PCLSs (D) and medium (E). (F) Representative images of H&E staining on PCLSs (scale bar = 100 µM, black arrows indicate microvesicular steatosis, red arrows indicate macrovesicular steatosis). (G) Altered GO biological processes by GFIPO compared to WEGG in fatty acid with different chain lengths (& indicates significantly changed compared to the corresponding WEGG). Data are presented as mean ± SEM. (#) denotes statistical differences between GFIPO and WEGG at each time point, while (*) denotes statistical differences in GFIPO or WEGG compared to their corresponding 24 h; *(#) p < 0.05, ** p < 0.01, ***(###) p < 0.001.
Figure 6
Figure 6
Gene regulation in inflammatory response of GFIPO compared to WEGG in PCLSs. (AD) GSEA plots of hallmark inflammatory response pathway at each time point: (A) 24 h, (B) 48 h, (C) 72 h, and (D) 96 h; below are up-regulated genes involved in TNFα signaling via NFκB pathway. (EG) mRNA expression of inflammatory biomarkers (TNF, IL6, IL1β) in PCLSs after up to 96 h of incubation. (H) Secretion of inflammatory cytokines by PCLSs after up to 96 h of incubation (100% to WEGG 24 h). Data are presented as mean ± SEM, (*) denotes statistical differences between GFIPO and WEGG at each time point; * p < 0.05, ** p < 0.01, *** p < 0.001.
Figure 7
Figure 7
Development of liver fibrosis in PCLSs by GFIPO compared to WEGG. (AD) GSEA plots of hallmark TGFβ signaling pathway at each time point: (A) 24 h, (B) 48 h, (C) 72 h, and (D) 96 h. (E) Dysregulation of reactome pathways (“Signaling by TGFβ family members”, “Signaling by TGFβ Receptor Complex”, “TGFβ receptor signaling activates SMADs”, “Transcriptional activity of SMAD2/SMAD3:SMAD4 heterotrimer”, and “SMAD2/SMAD3:SMAD4 heterotrimer regulates transcription”) in TGFβ signaling, ranked by NES value on the scale bar (NES > 0, up-regulated; NES < 0, down-regulated). (F,G) mRNA expression of inflammatory biomarkers (COL1A1, ACTA2) in PCLSs after up to 96 h of incubation. (H,I) Secretion of pro-collagen 1a1 and TIMP1 from PCLSs after up to 96 h of incubation. (J) Representative images of Picro Sirius Red staining on PCLSs (scale bar = 1 mM) and quantitative analysis of positive areas (control to WEGG 24 h) using ImageJ. Data are presented as mean ± SEM. (#) denotes statistical differences between GFIPO and WEGG at each time point, while (*) denotes statistical differences in GFIPO or WEGG compared to their corresponding 24 h; *(#) p < 0.05, **(##) p < 0.01, ***(###) p < 0.001.

Similar articles

Cited by

References

    1. Teng M.L., Ng C.H., Huang D.Q., Chan K.E., Tan D.J., Lim W.H., Yang J.D., Tan E., Muthiah M.D. Global incidence and prevalence of nonalcoholic fatty liver disease. Clin. Mol. Hepatol. 2023;29:S32–S42. doi: 10.3350/cmh.2022.0365. - DOI - PMC - PubMed
    1. Powell E.E., Wong V.W.-S., Rinella M. Non-alcoholic fatty liver disease. Lancet. 2021;397:2212–2224. doi: 10.1016/S0140-6736(20)32511-3. - DOI - PubMed
    1. Neuschwander-Tetri B.A. Non-alcoholic fatty liver disease. BMC Med. 2017;15:45. doi: 10.1186/s12916-017-0806-8. - DOI - PMC - PubMed
    1. Santhekadur P.K., Kumar D.P., Sanyal A.J. Preclinical models of non-alcoholic fatty liver disease. J. Hepatol. 2018;68:230–237. doi: 10.1016/j.jhep.2017.10.031. - DOI - PMC - PubMed
    1. Willebrords J., Pereira I.V.A., Maes M., Yanguas S.C., Colle I., Bossche B.V.D., Silva T.C.D., Oliveira C.P.M.S.d., Andraus W., Alves V.A., et al. Strategies, models and biomarkers in experimental non-alcoholic fatty liver disease research. Prog. Lipid Res. 2015;59:106–125. doi: 10.1016/j.plipres.2015.05.002. - DOI - PMC - PubMed

Substances